Curve Fitting Software: 7 Best to Use in 2024
![]() 6 min. read
6 min. read
![]() Updated on
Updated on
Share this article

Improve this guide
Read our disclosure page to find out how can you help Windows Report sustain the editorial team Read more
Key notes
- The best curve fitting software will help you create graphs for scientific research.
- We've also included lots of free curve fitting software for you to try out.
- Boost your productivity with a premium curve fitting program from the list.
- Know that some of the items on the list below can be used for Chemistry as well.

Curve fitting software packages are specialized programs that apply curve fits to all your data sets. If you need to generate graphs, you can also use the built-in Windows 10 Office Excel.
However, if you want to create complex, scientific graphs you should use dedicated curve fitting software.
What’s the best curve fitting tool to use?
Adobe XD

Adobe XD is a top vector-based user design tool that is usually known for creating user interfaces for both mobile and web apps.
Therefore, with the help of Adobe XD, you can easily create a curve by adding an anchor point where a curve changes direction. Then, you just need to drag the direction lines that shape the curve.
Keep in mind that the length and slope of the direction lines are the ones determining the shape of the curve.
Moreover, you can create a series of smooth curves by dragging the Pen tool from different locations. You may even draw straight lines followed by curves or two curved segments connected by a corner.
Add to the list many curve-fitting features that are readily available in Adobe XD. And as a quick tip, your system can display and print curves so much easier when you draw them using as few anchor points as possible.
Some of the Adobe XD key features you’ll most likely appreciate using are:
- Supports any type of files from Adobe Photoshop, After Effects, and Illustrator
- Voice commands may be used to design apps
- Mac OS and Windows compatibility
- iOS and Android Adobe XD versions to let you preview the result of work on mobile
- Compatible with custom plugins to help you gain additional uses

Adobe XD
Powerful and user-friendly set of tools to design websites and apps that fit any device and share your ideas with your team.GraphPad’s Prism

Prism is a popular curve fitting software developed by GraphPad. This tool combines scientific graphing, comprehensive curve fitting, statistics, and data organization.
Prism is a tool used mainly by scientists, undergraduate, and graduate students. This fact alone confirms it’s a highly reliable tool and offers a wide array of features that can meet the needs of all the users.
If you’ve never used Prism before, there’s no need to panic. The Learn feature and Prism’s online documentation plainly explain you the principles of the analysis.
They will help you better understand the processes and principles of nonlinear curve fitting so you can start using the software as fast as possible.
Prism is a useful pedagogical tool at the same same, teaching you what you need to know to analyze your data.
If you’re working on a project that involves several data experiments, Prism can record all your experiments, helping you to visualize the results in time.
GitHub’s SciDAVis
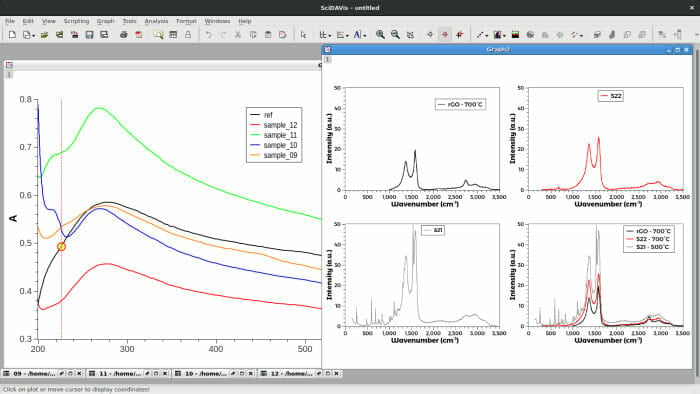
SciDAVis is the short name for Scientific Data Analysis and Visualization, which is an open-source program for interactive scientific graphing and data analysis.
The tool generates 2D and 3D plots from data that is imported from ASCII files, entered by hand, or calculated using formulas. These plots can then be exported to several bitmap formats such as PDF, EPS and more.
The tool is primarily aimed at high-quality plotting of scientific data. It combines an intuitive, easy-to-use user interface with powerful features such as Python scriptability.
SciDAVis’ main advantage is its emphasis on providing a friendly and open environment for new and experienced users alike.
Thanks to good documentation on all levels, such as the user’s manual and tutorials, users can quickly learn to master the tool. Moreover, they can share their experiences on SciDAVis’ forums.
SigmaPlot

SigmaPlot is a complex data analysis tool that also supports curve fitting, allowing you to describe the shape and behavior of your data.
You can use this tool for simple curve fitting tasks, as well as for complicated curve fitting problems.
SigmaPlot’s Dynamic Fit Wizard helps you to find the best solution for complex curve fitting tasks, by automating the search for initial parameter values to find the best solutions.
In other words, the Dynamic Fit Wizard is actually a step-by-step guide through the curve fitting procedures, that also comes with an additional panel in which you set the search options.
This feature is recommended for tasks with three or more parameters and a large number of variables.
You can try SigmaPlot for free for 30 days or buy the tool for $100 from Systat Software.
TriLookup
TriLookup is an add-on for Microsoft Excel that adds eleven powerful lookup and interpolation worksheet functions to this program, offering enhanced functionalities.
You can use the add-on to perform interpolation and extrapolation from tables with one, two, or three independent variables.
TriLookup was launched in 2003 and has been used by universities and hi-tech companies ever since.
If you’ve never seen this tool before, you can use the online example spreadsheets that demonstrate the capabilities and the usage of the added functions.
Starting from version 3.0, there are two TriLookup versions available: TriLookup Lite, the freeware edition , and the standard TriLookup version.
Kintecus

Kintecus is a great tool to use if you work in the field of chemistry. You can use it to run chemical kinetics of catalyst reactor, and enzyme reactions, and model equilibrium of combustion and nuclear reactions.
Kintecus accurately displays real-life phenomena and reactions and the graphical interface is actually a collection of Visual Basic scripts implemented through an Excel interface.
However, some users are annoyed by the fact that the interface requires Excel, but if you don’t want to install Excel, you can also run Kintecus only in command line mode.
You can download the program for free by registering as an academic/educational user.
Gwyddion
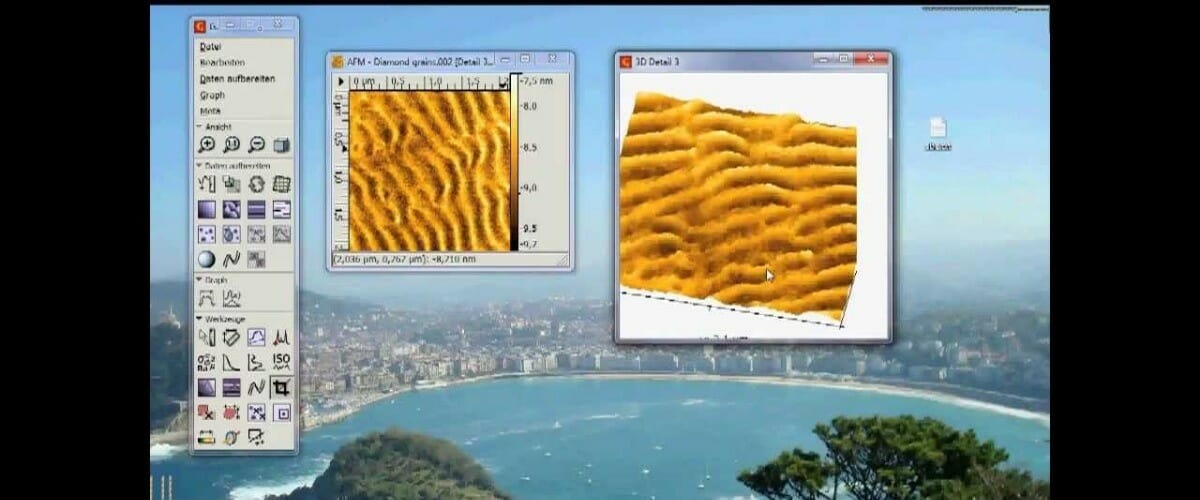
Gwyddion is a modular multiplatform software for scanning probe microscopy data analysis. It is a free software tool, allowing developers to further improve it.
Its main function is to analyze the height fields obtained by scanning probe microscopy techniques (AFM, MFM, STM, SNOM/NSOM).
Gwyddion supports more than 40 features such as force-distance curve fitting, volume force-distance curve fitting, location of peaks in graph curves, and more.
Unlike Kintecus, Gwyddion has a modern, intuitive user interface, allowing users to quickly analyze data and identify the main values.
All calculations are done in double precision, and Gwyddion native data format (.gwy) stores data in double precision, as well.
These are the best curve fitting software you can use on your Windows 10 computer. As you can see, some of these tools can be used for various fields, while others are field-specific.
If you’ve used other curve fitting tools that you think should be on this list as well, you can tell us more about your experience in the comment section below.