
How to Map a Quantum Experiment From Software to Readout


 4 min. read
 Published on
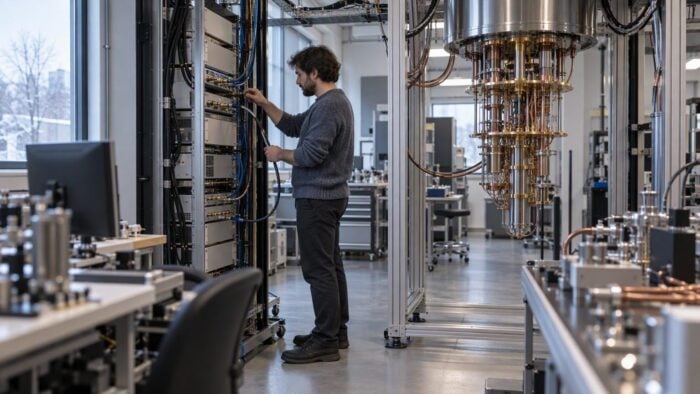
This how-to walks readers through documenting a quantum experiment from the host computer to pulse generation, synchronized control, measurement, and feedback. Each step identifies what information should cross the boundary, where timing matters, and how researchers can verify that the intended sequence matches the recorded output. Troubleshooting sections cover unclear signal paths, mismatched timing assumptions, and incomplete readout plans without claiming that ordinary Windows PCs directly control qubits. It targets Windows Report readers who work in research computing, engineering, or quantum software and need a practical systems overview.
In quantum computing research, an experiment can look sound in desktop software yet yield unusable measurements at the detector. When an acquisition window drifts by mere nanoseconds or a clock assumption fails, the programmed pulse sequence and the recorded dataset fall out of sync. Resolving these discrepancies requires understanding the architecture bridging the user interface and physical hardware: the quantum control stack.
Modern laboratories typically manage this pipeline from an everyday engineering workstation. Between high-level orchestration software running on a Windows PC and the sub-Kelvin environment of a dilution refrigerator lies an intricate series of hardware handoffs. By viewing the entire signal chain as a transparent, auditable continuum rather than an opaque black box, engineering teams can systematically trace how software instructions transform into physical analog waveforms and return as validated data.
The Division of Labor: Host PC vs. Real-Time Hardware
A central design principle across modern quantum control stacks is the deliberate separation between non-real-time orchestration and deterministic hardware execution.
Standard operating environments like Windows excel at high-level experiment design, heavy compilation, user interface interactions, and large-scale data ingestion. A researcher might define an algorithm using Python libraries, orchestrate parameter sweeps, and manage lab databases within Windows. However, standard operating system schedulers cannot provide the deterministic, sub-nanosecond timing precision required to manipulate fragile quantum states.
To bridge this gap, the Windows host compiles experimental sequences into structured instructions and offloads them to dedicated field-programmable gate arrays (FPGAs) or digital signal processors. While the Windows workstation manages experiment scheduling, driver handoffs, and final telemetry, the dedicated controllers govern real-time pulse generation, fast signal acquisition, and low-latency conditional feedback loops. Recognizing where the host operating system yields control to specialized execution electronics clarifies where timing discrepancies originate.
Tracing the Signal and Data Boundaries
Transforming abstract code into reliable quantum measurements involves several distinct operational boundaries:
- Host to Controller: The Windows workstation packages sequence identifiers, device configurations, and channel mappings via dedicated API calls or PCIe/Ethernet interfaces. Verification at this stage relies on compiled schedule logs and configuration receipts.
- Controller to Quantum Device: Specialized arbitrary waveform generators (AWGs) translate digital instructions into calibrated microwave or RF pulses. Downward signal accuracy is verified using oscilloscopes, loopback monitors, or controller hardware logs.
- Device to Acquisition: After interacting with qubits or quantum sensors, reflected or emitted signals pass into analog-to-digital converters (ADCs). Verification depends on analyzing raw in-phase and quadrature (I/Q) samples or photon time-tag records against the expected capture window.
- Hardware Processing Back to Host: Onboard FPGA logic demodulates, integrates, and classifies incoming signals based on predefined thresholds. The finalized state determinations then stream back to Windows storage, labeled with matching run identifiers.
Establishing Timing Consistency and Traceability
Because timing errors compound rapidly, synchronization across heterogeneous instruments is essential. Even minute offsets between drive pulses and readout resonator acquisition windows can induce unwanted Stark shifts, degrade gate fidelity, or produce erroneous state assignments during active reset protocols.
A robust experimental pipeline establishes a unified timing ledger across all instruments. This ledger documents trigger origins, cable lengths, filter delays, and digital latency. Event durations within the sequence are tracked relative to a common master clock, ensuring that the hardware controllers and the supervisory host share a consistent reference frame.
Maintaining end-to-end data provenance ensures anomalous results can be diagnosed without guesswork. Assigning a persistent run identifier across every stage—from the sequence submitted in Windows to the waveforms recorded on the controller to the raw I/Q samples captured by the digitizer—lets teams systematically isolate hardware misalignments.
A Unified View of Laboratory Infrastructure
Quantum research demands seamless collaboration between high-level development environments and low-latency instrumentation. By treating quantum control stacks as an integrated pipeline—where Windows environments oversee experiment architecture and dedicated hardware enforces real-time precision—laboratories turn complex quantum physics experiments into verifiable, repeatable engineering workflows.


Read our disclosure page to find out how can you help Windows Report sustain the editorial team. Read more


Improve this guide



User forum
0 messages