Now, Microsoft Graph activity logs is generally available for you to track user activity and more
It was made available from April 11, 2024
4 min. read
Published on
Read our disclosure page to find out how can you help Windows Report sustain the editorial team Read more
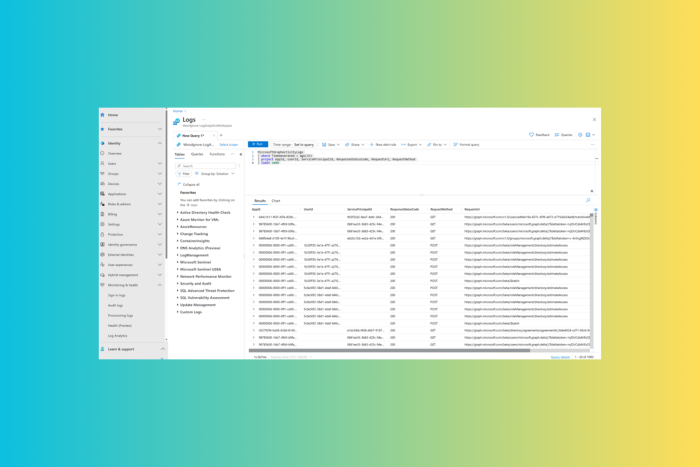
Recently, Microsoft announced that Graph Activity Logs would be available to the general public. Microsoft Graph activity logs allow data source you to perform security analysis and monitor application activity and threat hunting in your tenant.
Here are the use cases mentioned in the blog post:
- Identifying the activities that a compromised user account conducted in your tenant.
- Building detections and behavioral analysis to identify suspicious or anomalous use of Microsoft Graph APIs, such as an application enumerating all users, or making probing requests with many 403 errors.
- Investigating unexpected or unnecessarily privileged assignments of application permissions.
- Identifying problematic or unexpected behaviors for client applications, such as extreme call volumes that cause throttling for the tenant.
In the existing scenario, you can collect sign-in logs to examine authentication activity and audit logs to see changes to important resources.
However, now, with Microsoft Graph activity logs, you can scrutinize the complete picture of activity in your tenant, including token requests in the sign-in log, API request activity, ultimate resource changes in audit logs and more.
In the blog post, Microsoft also mentioned some basic queries to illustrate how to work with these logs:
Summarize applications and principals that have made requests to change or delete groups in the past day:
MicrosoftGraphActivityLogs | where TimeGenerated > ago(1d) | where RequestUri contains ‘/group’ | where RequestMethod != “GET” | summarize UriCount=dcount(RequestUri) by AppId, UserId, ServicePrincipalId, ResponseStatusCode See recent requests that failed due to authorization:
MicrosoftGraphActivityLogs | where TimeGenerated > ago(1h) | where ResponseStatusCode == 401 or ResponseStatusCode == 403 | project AppId, UserId, ServicePrincipalId, ResponseStatusCode, RequestUri, RequestMethod | limit 1000 Identify resources queried or modified by potentially risky users:
Note: This query leverages Risky User data from Entra ID Protection.
MicrosoftGraphActivityLogs | where TimeGenerated > ago(30d) | join AADRiskyUsers on $left.UserId == $right.Id | extend resourcePath = replace_string(replace_string(replace_regex(tostring(parse_url(RequestUri).Path), @'(\/)+’,’/’),’v1.0/’,”),’beta/’,”) | summarize RequestCount=dcount(RequestId) by UserId, RiskState, resourcePath,RequestMethod, ResponseStatusCode
Microsoft Graph activity logs are available via the Azure Monitor Logs integration of Microsoft Entra, and admins can configure the collection and storage destinations of Microsoft Graph activity logs using the diagnostic setting in the Entra portal.
To access the Microsoft Graph activity logs, you need to have the following:
- A Microsoft Entra ID P1 or P2 tenant license in your tenant.
- An administrator with one of the following Microsoft Entra administrator roles listed in the order of least to most privileged role.
- Security Administrator – To configure diagnostic settings
- Global Administrator – To configure diagnostic settings
- An Azure subscription with one of the following log destinations are configured, and permissions to access data in the corresponding log destinations.
- An Azure Log Analytics workspace to send logs to Azure Monitor
- An Azure Storage Account for which you have List Keys permissions
- An Azure Event Hubs namespace to integrate with third-party solutions
You should also consider these limitations mentioned on the Microsoft Learn page
- The Microsoft Graph activity logs feature allows the tenant administrators to collect logs for the resource tenant. This feature doesn’t allow you to see the activities of a multitenant application in another tenant.
- You can’t filter Microsoft Graph activity logs through diagnostic settings in Azure Monitor. However, options are available to reduce costs in Azure Log Analytics Workspace. For more information, see Workspace transformation.
- In most regions, the events will be available delivered to the configuration destination within 30 minutes. In less common cases, some events might take up to 2 hours to be delivered to the destination.
What do you think about Microsoft Graph activity logs? Tell our readers in the comments section below.

