How to add a calculated column in Power BI [SUPER GUIDE]
![]() 3 min. read
3 min. read
![]() Updated on
Updated on
Share this article

Improve this guide
Read our disclosure page to find out how can you help Windows Report sustain the editorial team Read more

Power BI is an incredibly useful tool when it comes to making calculations. However, quite a few users are encountering issues with adding a calculated column in Power BI.
One user described the problem on the official forum:
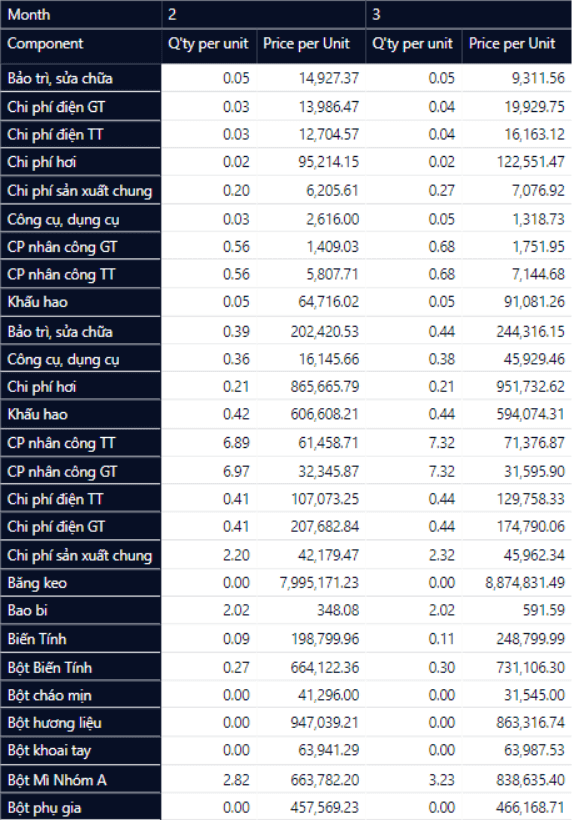
I’m quite new with Power Bi and i am using a matrix to group my data like this (image below). Now I want to add a new column which allow me to make a new calculation = ([q’ty per unit of 3rd month] – [q’ty per unit of 2nd month]) * [Price per Unit of 3rd month]
Is there any simple way help me to do so since I’m not an expect with DAX. Thanks for your help.
So, the OP wants to add a new column that will allow a new calculation. Today we will show you how to do that in a few easy steps.
Steps to add a calculated column in Power BI
1. Create a measure using DAX
DAX stands for Data Analysis Expression and it is the formula language in Power BI. Here you can add functions and formulas for your columns like in the image below.
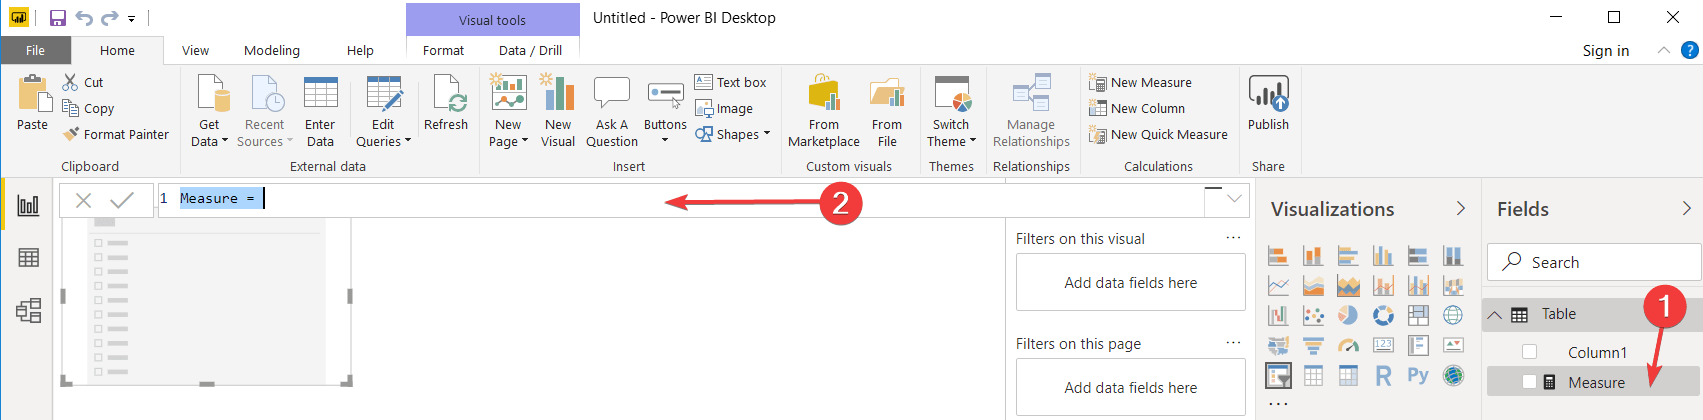
In the upper case (second arrow), add the following:
Result =
VAR qty_per_unit_of_3rd_month =
CALCULATE ( MAX ( Table[q’ty per unit] ), FILTER ( Table, Table[Month] = 3 ) )
VAR qty_per_unit_of_2rd_month =
CALCULATE ( MAX ( Table[q’ty per unit] ), FILTER ( Table, Table[Month] = 2 ) )
VAR Price_per_Unit_of_3rd_month =
CALCULATE ( MAX ( Table[Price per Unit] ), FILTER ( Table, Table[Month] = 3 ) )
RETURN
qty_per_unit_of_3rd_month – qty_per_unit_of_2rd_month * Price_per_Unit_of_3rd_month
Adapt the values to make the formulas work for your case.
This guide will make you a better Power BI user. Do check it out now.
2. Apply the measure directly to the slicer
You can also modify the measure as below:
Result =
VAR qty_per_unit_of_first_month_in_slicer =
CALCULATE ( MIN ( Table[q’ty per unit] ), ALLSELECTED ( Table ) )
VAR qty_per_unit_of_last_month_in_slicer =
CALCULATE ( MAX ( Table[q’ty per unit] ), ALLSELECTED ( Table ) )
VAR Price_per_Unit_of_last_month =
CALCULATE (
MAX ( Table[Price per Unit] ),
FILTER ( Table, Table[Month] = qty_per_unit_of_last_month_in_slicer )
)
RETURN
qty_per_unit_of_last_month_in_slicer – qty_per_unit_of_first_month_in_slicer * Price_per_Unit_of_last_month
The second measure applies directly to the slicer, so you can compare different months, such as the first and the last.
Conclusion
With calculated columns, you can organize and visualize your data in various ways. But first, you need to know a few basic principles and measures for these columns. They are pretty easy to work with once you get to understand them.
How do you add calculated columns in Power BI? Do let us know in the comments section below!
RELATED ARTICLES YOU NEED TO CHECK OUT: