How to see the diagnostic data Windows 10 is sending to Microsoft
2 min. read
Published on
Read our disclosure page to find out how can you help Windows Report sustain the editorial team Read more

With the Windows 10 April 2018 update, Microsoft finally reduced some of the secrecy around its Windows 10 telemetry collection. You can now view the diagnostic data which your PC is sending home to Microsoft, although it won’t necessarily be easy to understand.
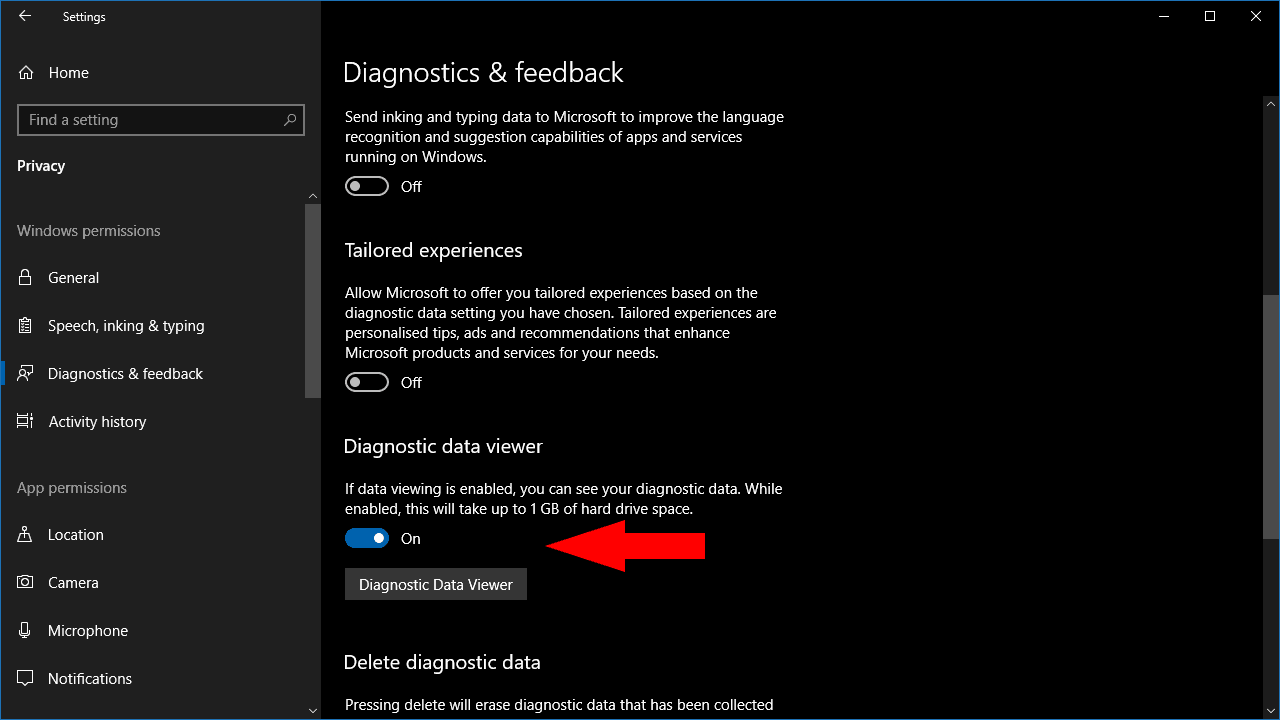
First, you have to explicitly enable diagnostic data viewing from the Settings app. Open Settings and navigate to Privacy > Diagnostics & Feedback. Scroll down the page to the “Diagnostic data viewer” section.
Under this heading, turn the toggle button to the on position. Diagnostic files will now be retained on your device, so you can view them. This will consume additional space – Microsoft estimates up to 1GB – as diagnostic files are normally removed after they’re uploaded to the cloud.
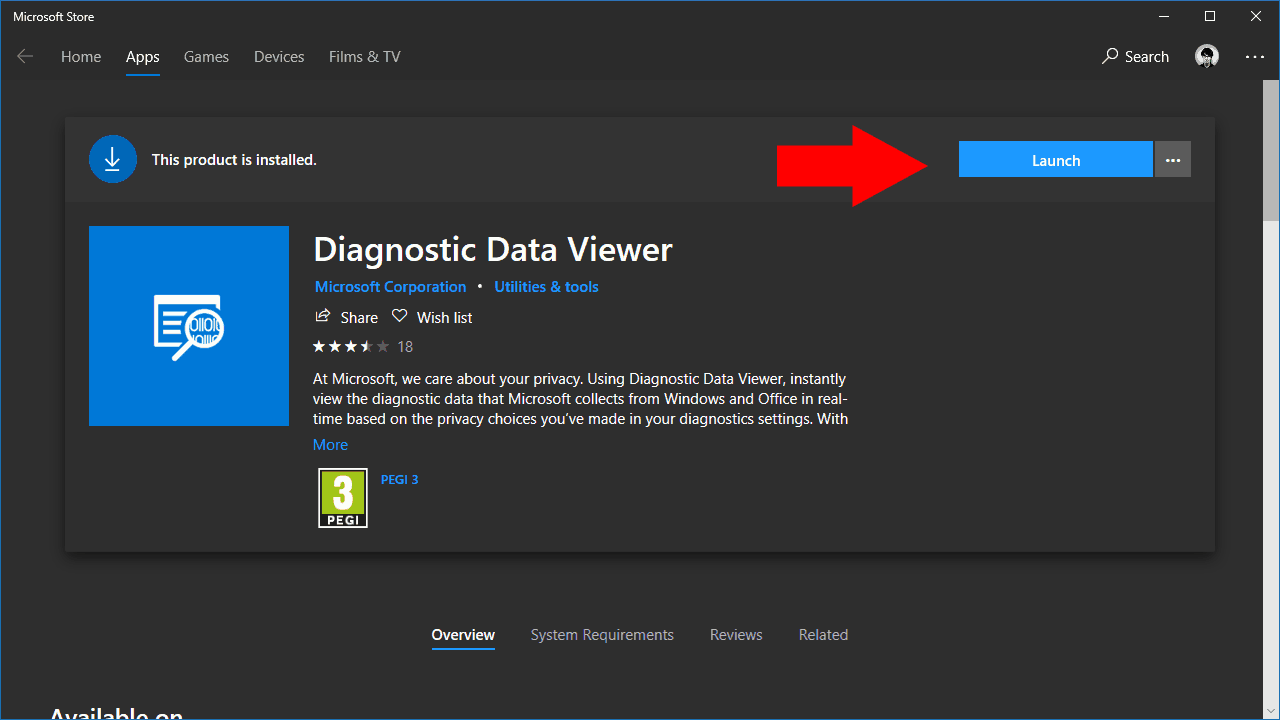
Although you’ve enabled telemetry viewing, the Settings app doesn’t provide a way to actually access the files. Instead, you’ll need a separate app, “Diagnostic Data Viewer,” from the Microsoft Store. Click the “Diagnostic Data Viewer” button to open a link to the Store. Click the blue “Get” button to download the app.
Once the app has installed, click the blue “Launch” button on the Microsoft Store page to open it. Alternatively, search for the app in the Start menu.
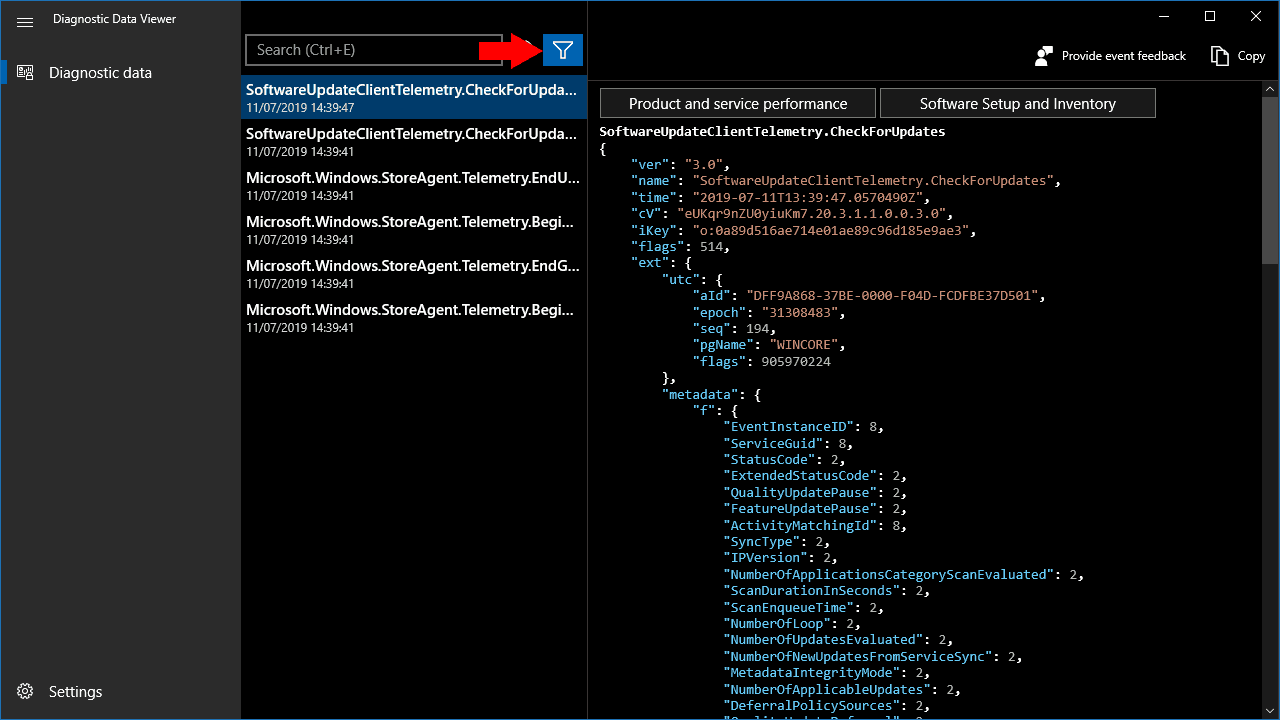
The app has a simple two-pane layout. On the left, you’ll see a list of all the diagnostic files on your device; on the right, the contents of each file appears when it’s selected. If you’ve only just enabled diagnostic viewing, there may not be many files to show – it will take time for diagnostic logs to be created and stored on your device.
You can filter the diagnostic data using the filter button at the top of the interface, next to the search bar. This lets you choose to view a specific category of telemetry information, which might be helpful when investigating a particular problem on your device.
Unfortunately, you may find the diagnostic data hard to interpret, unless you’re already fairly familiar with Windows internals. The data is presented in its raw JSON format. If you were hoping for a readable breakdown of what’s being sent, you’re still out of luck. The telemetry contains a wealth of your data about your device and the events occurring on it, but the lack of explanation may leave you none the wiser when it comes to understanding what Microsoft is collecting.

