Microsoft’s new tool gives you a street-by-street view of digital inequality in the USA
2 min. read
Published on
Read our disclosure page to find out how can you help Windows Report sustain the editorial team Read more
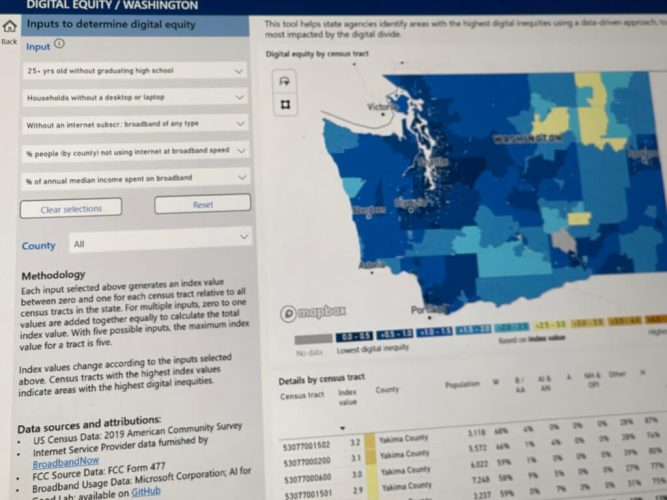
Microsoft has a new tool to give you a street-by-street view of digital inequality in the USA. Built on PowerBi, the tool looks at 20 different indicators of digital equity and tells a story of access to the internet and other digital technologies.
Available here, Microsoft’s tool was developed by their Chief Data Science Officer Juan Lavista Ferres and the Microsoft AI for Good Lab. The tool pulls data from public places. That includes the Census Bureau, Federal Communications Commission (FCC), BroadbandNow, and Microsoft’s own Broadband Usage Data. Also in consideration with the tool are factors like broadband access, usage, education, and poverty rates.
The goal of this tool is to give policy makers the tools they need to find trends and places in states that need investments in digital resources like broadband internet. As an example, Microsoft points out that in Ferry County, Washington, 97% of the county aren’t using the internet at broadband speeds. That goes against the FCC’s own data that claims only 0.4% of households lack access to broadband. Even in Los Angeles, more than a quarter of residents aren’t using the internet at broadband speeds, according to Microsoft’s data.
Check it out now, and you might end up surprised as to which percentage of the population doesn’t have access to proper digital resources in your neighborhood.

User forum
0 messages