Power BI June update brings new UI and AI assisted graphics
2 min. read
Updated on
Read our disclosure page to find out how can you help Windows Report sustain the editorial team Read more
Key notes
- Microsoft announced the new Power BI June update for the desktop application.
- It comes with new UI features and AI-assisted graphics. Read all about the new updates below.
- All the news about Power BI business tool will be found in the Power BI News section.
- For all the information about Power BI, including support and tutorials, head over to our Power BI Hub.

For those who are not aware, Power BI is a suite of business analytics tools that you can use to analyze data and share insights with colleagues and partners.
It’s a complex tool for monitoring your business available on every device.
What’s new in the Power BI June update?
The list of the new updates is impressive, to say the least, but must of them fall on the user interface category.
What caught our attention is the hierarchical slicer that is now supported by AI visuals.
Microsoft also provided an example where you can see that the hierarchical slicer is cross-filtering the Key influencers visual.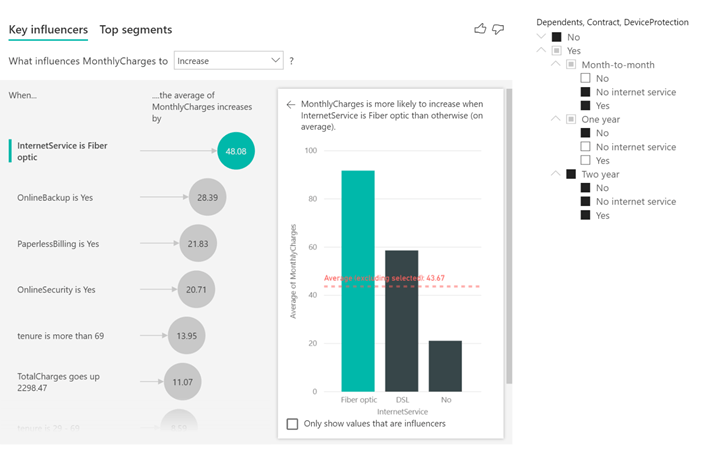
AI Insights available for everyone
Microsoft also announced that the AI Insights from the Power Query is now generally available.
AI Insights give you access to a collection of pre-trained machine learning models that enhance your data preparation efforts.
These include text analytics functions (sentiment scoring, key phrase extraction and language detection), image detection as well as connectivity to Azure ML models.
The complete list of Power BI updates
Here’s the complete list of June updates, as they appear on the Power BI blog:
Reporting
-
Enhancements to mobile layout authoring
- New phone emulator
- Updated visualization pane
- Support for overlaid visuals
- Automatic page refresh is now generally available
-
Hierarchical slicer is now generally available
- New options for expand/collapse icons
- Icons now scale with font size
- Ability to customize indentation for child items
- Supported with AI visuals
- Modern ribbon is now generally available
- RLS is now supported for Featured Tables in Excel’s Data Types gallery
Analytics
- AI insights are now generally available
Visualizations
- Line chart dot formatting options
- Radar chart by MAQ Software
- ValQ for Modern Visual Planning
- Advanced Trellis by xViz
- Updates to Gantt chart by xViz
- Updates to Cards with States by OKViz
Template apps
- Agile HR Analytics
- Uber User Data Report
Modeling
- Model view enabled for live connect (preview)
- Updates to Model view
Data connectivity
- Palantir Foundry connector
Other
- New Power BI trainings
Do you use Power BI? What do you think about the new update? Tell us about your experience in the comments sections below.
[wl_navigator]

