How to generate a battery health report for your Windows 10 laptop or tablet
4 min. read
Published on
Read our disclosure page to find out how can you help Windows Report sustain the editorial team. Read more
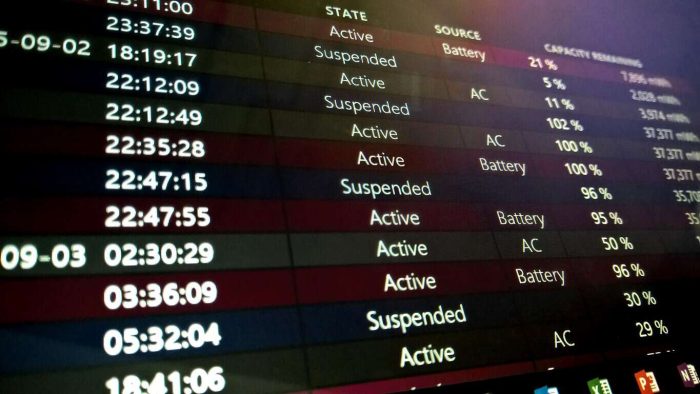
Device batteries don’t last forever. After a few years of solid use, you’ll notice that your laptop or tablet begins to require charging more frequently as the lithium-ion cells start to age. If you want to monitor your battery’s deterioration, Windows’ built-in battery health report lets you check its state over time.
The battery health report was introduced with Windows 8. It’s a hidden feature that provides a wealth of information on your system’s battery and how it’s faring. You can’t access the report from the Windows interface. It’s only available from an administrator Command Prompt or PowerShell window, so most people aren’t aware it exists.
First, open a terminal by right-clicking the Start button and selecting “Command Prompt (Admin)”. On post-Creators Update builds of Windows 10, you may see PowerShell in this menu instead of Command Prompt. It doesn’t matter which you use but you must select the “Admin” version. Confirm the User Account Control dialogue to open the terminal.
You can only need to type one command to generate the battery report. Enter “powercfg /batteryreport” (without the quotations) and press enter. This will save the battery report to the default location in the Windows folder. It’s generated as an HTML webpage which you can view in a web browser. To open it without leaving Command Prompt, type “battery-report.html” and press enter. This will open the report in your default browser.
The first section of the report provides some basic information on your device and its batteries. Under the “Installed batteries” subheading, you can see the manufacturer and model of each of your system’s batteries. You can also check the design capacity and current full charge capacity of each battery. The design capacity indicates the theoretical charge of the battery when it was new from the factory.
The next section shows how your device has used energy over the past three days. You can see when different power-saving modes, such as Connected Standby, were active and how much charge was depleted during each of your sessions. Below this, there’s a detailed “Usage History” report which gives an overview of how long you’ve been using your device for over time.
Further down the page, you’ll find the “Battery capacity history” heading. This is the most valuable insight into the degradation of your battery over time. You should see that the “Full Charge Capacity” of your battery gradually gets lower as the months go by. You should notice a gradual downward trend with a few mWh being depleted each month.
Sometimes, there may be anomalies where the full charge capacity heads back up again. Calculating full charge capacity is an inexact science and your battery won’t always charge to the same level on each cycle. However, any significant jumps in the data could signal a defect in your battery. It’s worth checking the report if you suspect a fault is developing.
The last section of the report shows how your device’s estimated runtime has changed over time. While this may be expected to decrease in proportion with the battery capacity, in practice the trend could be skewed or non-existent.
Unless you rigidly use the same apps for months, your real-world battery usage will fluctuate significantly over time. Changes made to Windows in updates might improve efficiency, offsetting the gradual declines in your battery’s capacity. Alternatively, a few late night gaming sessions in quick succession could cause your battery life estimate to plunge, even though there’s been no change to the cell’s capacity.
The best way to assess the reduction in your device’s runtime is by looking at the very last entry in the report. Windows provides you with estimates of your device’s battery life at design capacity and at current capacity, based on aggregate data collected since the operating system was installed. While it’s still far from precise, the quoted figure is the best representation of how the gradual capacity decreases relate to real-world runtime.






User forum
0 messages