
Microsoft Engineer's New Open-Source Tool "GPU Taskman" Shows What's Eating Up Your GPU Memory


 2 min. read
 Published on
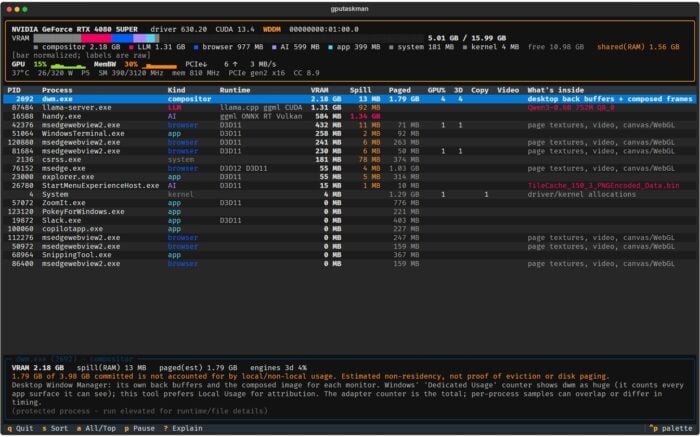
It’s true that Windows Task Manager can tell you how much GPU memory your PC is using. But figuring out exactly where that memory goes is another story. Microsoft developer Scott Hanselman has reportedly built a new tool to solve that problem. Called gputaskman, the open-source utility gives users a much closer look at GPU activity and memory consumption.
Scott Hanselman builds a better GPU monitoring tool
Hanselman introduced gputaskman through his GitHub repository, describing it as an htop-style task manager for GPUs. The tool breaks down GPU memory and activity by individual processes. It also tracks temperature, power consumption, clock speeds, encoder and decoder activity, and PCIe traffic.
Interestingly, the use case goes beyond conventional GPU monitoring. It can identify local AI workloads and provide details about loaded models. These include model weights, quantization, layer counts, and estimated KV-cache memory requirements.
That information could be useful for users running large language models locally. Instead of seeing a large VRAM usage number, they can investigate which applications and AI components are consuming resources.
It works across multiple platforms
gputaskman supports Windows 10 and 11 with NVIDIA and AMD graphics cards. It also supports NVIDIA GPUs on Linux and WSL, alongside Apple Silicon Macs. However, available readings vary depending on the operating system and hardware.
The project uses Windows GPU counters, NVIDIA’s NVML, and AMD’s monitoring interfaces. It combines those readings with information from running processes and local model files. Importantly, it does not inspect or dump arbitrary GPU memory.
You can download portable Windows builds from the GitHub Releases page. The project is also available under the MIT open-source license. That being said, Hanselman describes gputaskman as early experimental software. Some model memory breakdowns are estimates, and certain hardware readings may remain unavailable. The tool also does not monitor cloud-based workloads.
via: Neowin

Read our disclosure page to find out how can you help Windows Report sustain the editorial team. Read more


Improve this guide



User forum
0 messages