
What Is an ER Diagram? Understanding Database Relationships


 5 min. read
  Published on
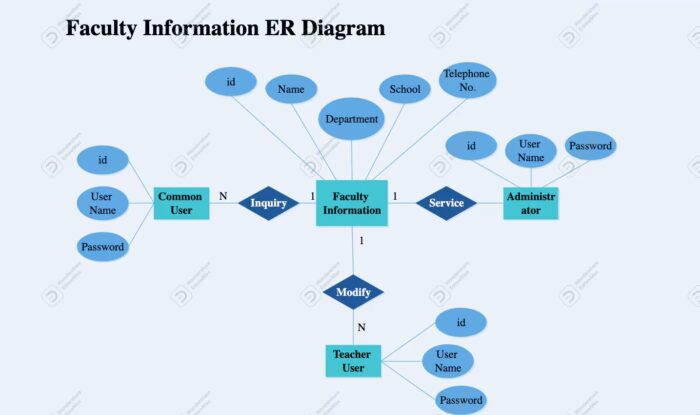
An entity relationship (ER) diagram is a visual way to show how information is organized in a database. It lets people see the main entities, the information stored about them and the relationships between them without having to work through database code.
A university database is a simple example. It might contain students, courses, instructors, and departments. An ER diagram can show how those parts fit together before the database is built.
ER modeling dates back to Peter Chen’s work in the 1970s. It has remained useful because the basic idea is not tied to one database platform. The same model can be used as a starting point for different database technologies.
Wondershare EdrawMax is one of the more common tools people reach for when they’d rather not draw entity boxes and relationship lines by hand in PowerPoint. It comes with ER-specific notation and templates built in, so the work of figuring out what connects to what doesn’t get lost in formatting.
The Main Components of an ER Diagram
Most ER diagrams revolve around three basic ideas: entities, attributes and relationships.
An entity represents something the database keeps information about, such as a customer, product, employee, course, order or patient.
An attribute describes an entity. A customer, for example, might have a customer ID, name, email address and phone number.
Relationships show how entities are connected. In a university database, students can enroll in courses and instructors can teach courses.
Understanding Cardinality
Cardinality describes how many records can be connected through a relationship. The common types are one-to-one, one-to-many, and many-to-many.
For example, one student can take several courses, while a course can have several students. That makes the relationship between students and courses many-to-many.
Common Types of ER Diagrams
ER models can be created at different levels of detail. A conceptual model gives a broad picture of the main entities and relationships. A logical model adds details such as attributes and keys while remaining independent of a particular database implementation.
A physical ER model is more closely tied to the database that will actually be built. It can include details such as data types, constraints and indexing.
Why ER Diagrams Matter in Database Design
Databases can become difficult to understand when they contain many connected tables and records. An ER diagram gives teams a visual reference and can make unclear requirements easier to spot.
It can also help developers, analysts and other stakeholders discuss data structures without having to work directly with SQL or database schemas.
Examples of ER Diagrams
A university database could include Student, Course, Instructor and Department. Students can be connected to courses through enrollment relationships, while instructors can be connected to the courses they teach.
ER Diagrams and Database Modeling Software
ER diagrams do not have to be drawn manually. Diagramming and database-modeling software can make it easier to organize entities, relationships and other elements.
Wondershare EdrawMax, for example, includes ER diagram templates and database symbols that can be used to create and refine database models. It can also help teams review or share a diagram.
The software is only part of the process, though. Good database design still depends on understanding the data, system requirements and relationships between entities.
Common Mistakes in ER Diagram Design
One common problem is combining concepts that should be represented separately. Unclear relationships can cause similar issues if it is not obvious how two entities are connected.
Frequently Asked Questions
What should an ER diagram include?
An ER diagram generally includes entities, attributes, and relationships. EdrawMax’s ER diagram examples show how these elements can be arranged to represent different database structures.
What is the difference between an entity and an attribute?
An entity represents something stored in a database, while an attribute describes information about it. EdrawMax uses these elements in its examples to illustrate different data structures.
What does cardinality mean in an ER diagram?
Cardinality describes how entities are connected and how many records can be associated. EdrawMax’s examples demonstrate different relationships within database models.
Why are ER diagrams useful?
ER diagrams provide a visual way to understand how data is organized and connected. EdrawMax’s examples show how this approach can be applied to systems such as universities and online shopping.
How can an ER diagram change over time?
An ER diagram can be updated as database requirements change or new relationships are added. EdrawMax provides examples for different systems and database structures.
Why ER Diagrams Matter
An ER diagram provides a simple visual way to understand how data is organized and how different parts of a database connect. By showing entities, attributes, relationships, keys and cardinality, it gives teams a common view of the structure they are working with.
Whether a project is being planned or moving toward implementation, an ER diagram can make database relationships easier to discuss and review. EdrawMax can support that work by providing a space to create and refine ER models.
If you work with database design or other technical projects, you can find more practical technology guides and software tips on Kemotech.


Read our disclosure page to find out how can you help Windows Report sustain the editorial team. Read more



Improve this guide




User forum
0 messages