How to add a secondary axis in Power BI [EASY STEPS]

Creating charts in Power BI Desktop is one of the main features of this tool, but quite a few users are encountering issues in creating the Y-axis (secondary axis).
One user reported the following on the official Power BI forum:
Currently using Power BI Desktop (just downloaded last week). I’m trying to create chart with secondary axis (Y-axis). However, in the tool, when I select from Visualization pane, ‘Y-Axis’ then ‘Show secondary’, nothing happens. In the video, I see that underneath that option when it is selected, there are other options to select like position it on ‘right’ side.
So, when trying to create a chart with a secondary axis (the vertical axis of the chart) through the usual method, nothing happens. Fortunately, the issue has a very easy solution.
Steps to add a secondary axis in Power BI
Add a metric to the line values
To solve the issue quickly, you simply add a metric to the line values.
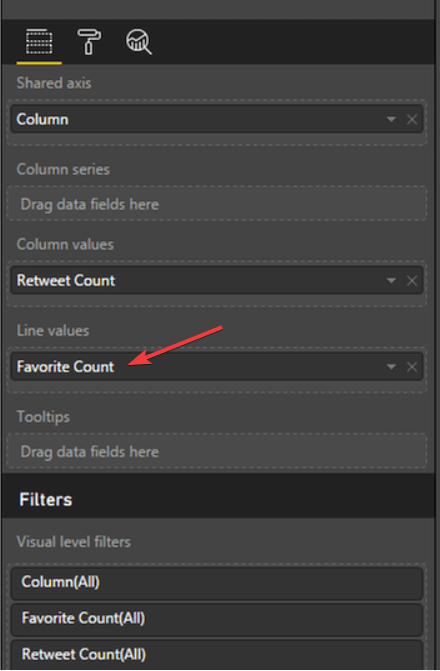
- Click on Favorite Count.
- Select the metric you prefer for your axis.
Conclusion
So, that’s about it. Adding a metric to Y-axis will allow you to create a chart with a secondary axis.
Leave your answer along with any other questions in the comments section below.
RELATED STORIES YOU NEED TO CHECK OUT:
Read our disclosure page to find out how can you help Windows Report sustain the editorial team. Read more


Improve this guide


User forum
0 messages