Monitor all Your Networking Assets with NetCrunch Software
Network monitoring is imperative for the protection of your business
Key notes
- NetCrunch is a top agentless monitoring network software with over 650 devices and applications monitoring templates.
- This solution also offers support for monitoring the configuration changes of over 180 popular devices, including scientific devices and sensors.
- In this article, we talk about the new features of NetCrunch 12 as well as how to get and install it.
NetCrunch is a top agentless monitoring network software with over 650 ready-to-apply monitoring templates for various types of hardware and applications.
This solution also offers support for monitoring the configuration changes of over 180 popular devices, including scientific devices and sensors.
In this article, we talk about the new features of NetCrunch 12 as well as how to get and install it.
Your network and the assets connected to it are the backbones of your business and NetCrunch is one of those solutions that helps you sleep better knowing that everything is all right.
Nowadays, it’s not enough to keep an eye on your servers and endpoints. That’s because you might be having virtual components and networking devices that can also be exploited.
That’s why here we’re going to talk about a software with a wide range of monitoring tools with capabilities that go outside typical network equipment.
How can NetCrunch 12 help me monitor my network?
NetCrunch is a modern, sleek tool for agentless monitoring and alerting computer networks,
traffic, and any device, sensor, service, or application that is part of such network.
Beautiful network visibility that can be easily customized and extended. Predefined, ready-to-use
monitoring templates for over 650 devices and applications.
This solution offers more than 20 integrations with the most popular helpdesks and collaboration tools for easy data sharing.
The software can monitor anything connected to an IP and it starts collecting data in just a few minutes because the setup is simple and agentless.
All you need to do is set up policies and alerting conditions so it can warn you of any possible issues.
The new, NetCrunch 12 version offers a lot of new features and capabilities. Let’s look at some of them below.
What are NetCrunch 12’s best features?
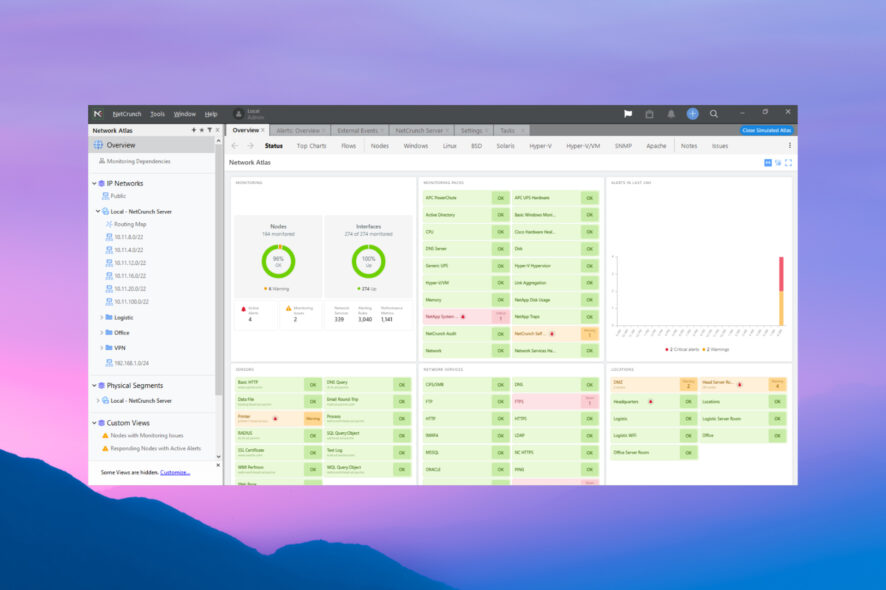
1. Redesigned and improved network maps and views
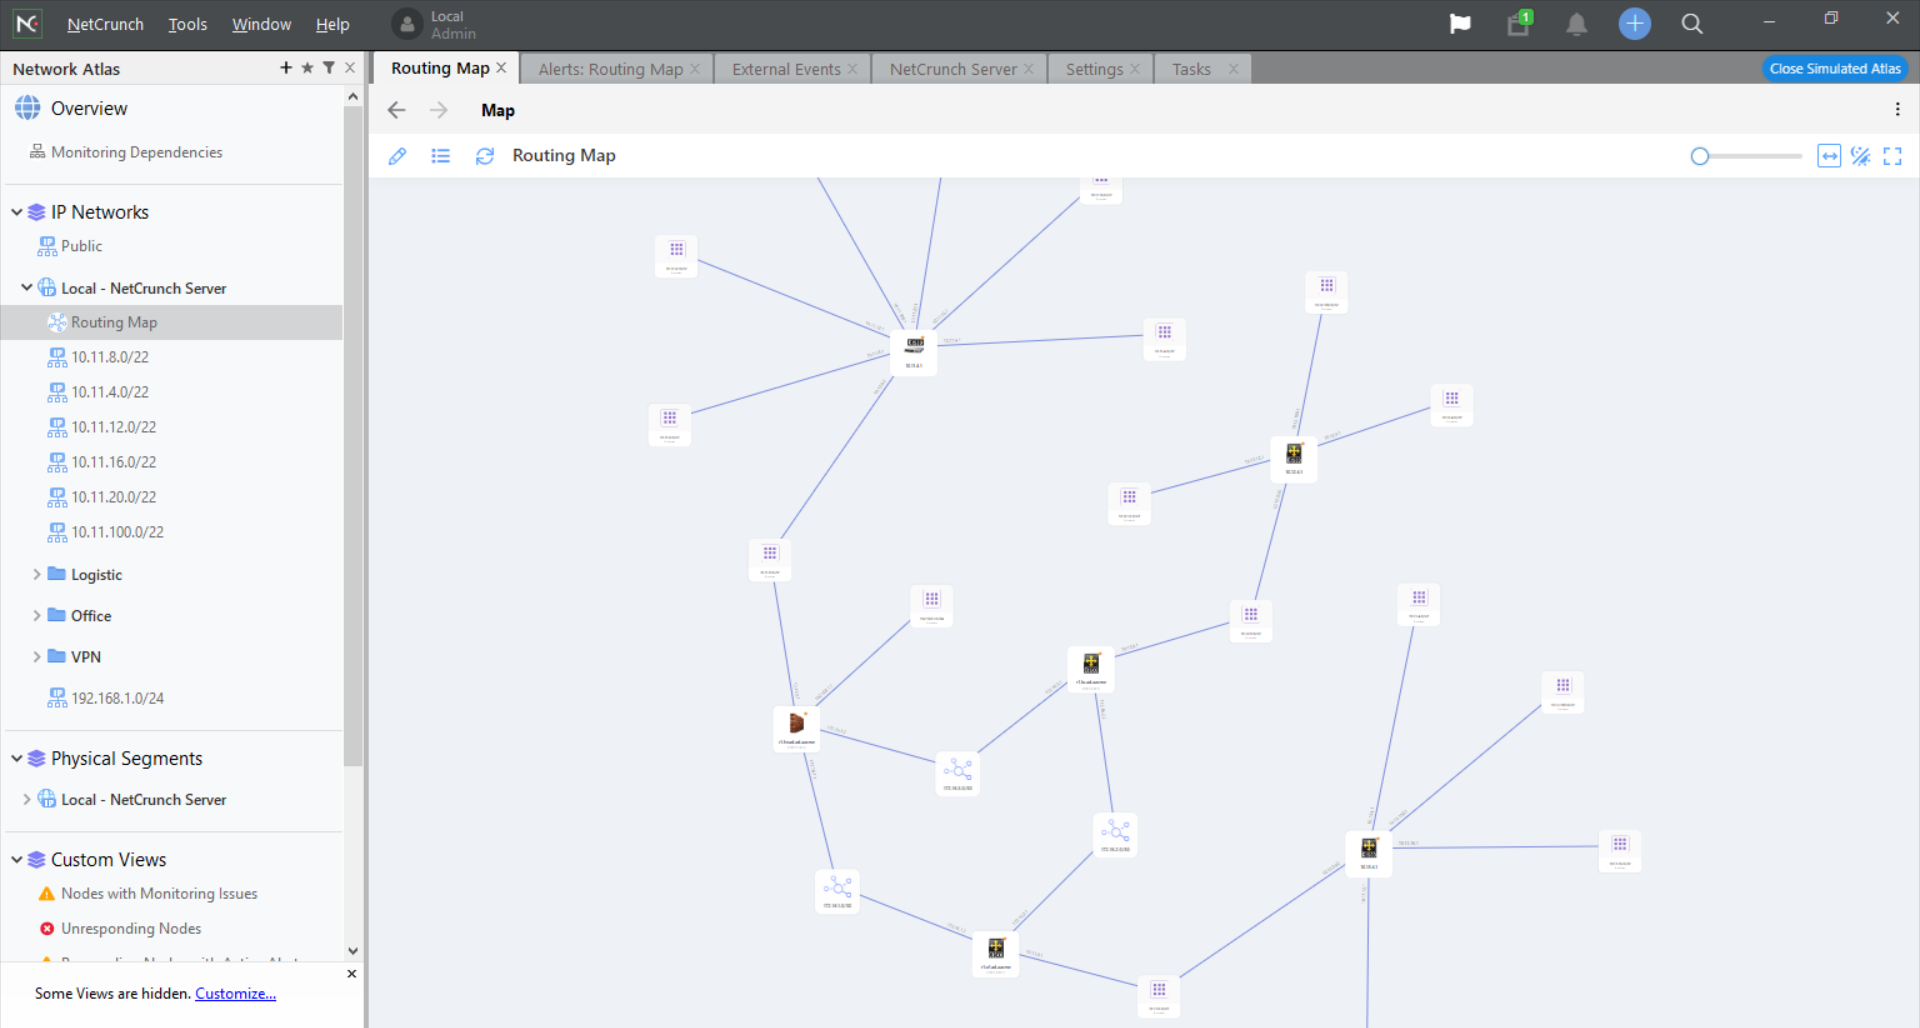
NetCrunch now shows you automatic network topology maps and routing maps that can be edited easily with your mouse.
It also has new dashboards and diagrams, new custom views with widgets, diagrams, and stats, all in a new modern look.
You can visualize any process that is part of your network and make a view of elements relevant for a specific admin job or location. And yes, there is also a dark mode for any views.
We know how important is to explain the situation and how you handle it. But NetCrunch provides all the tools to create an accurate and comprehensive report as well.
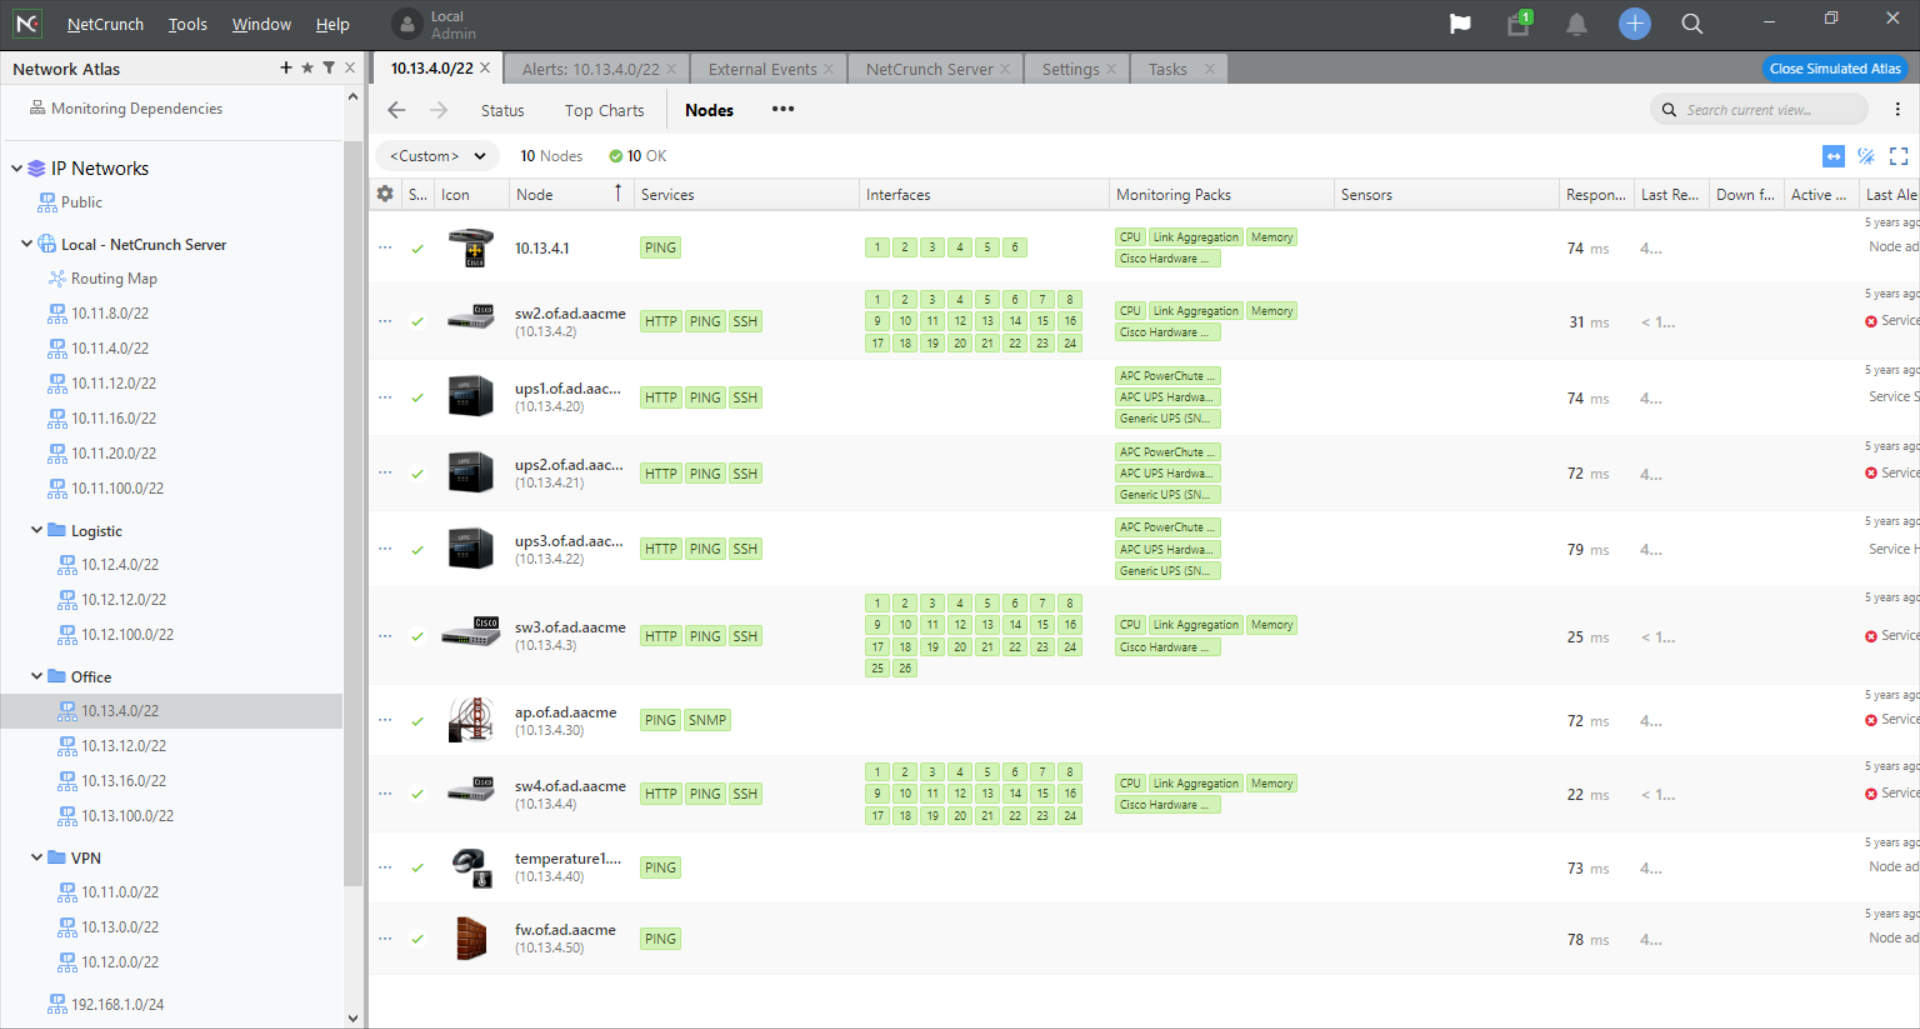
2. Revamped Network Services Status panel
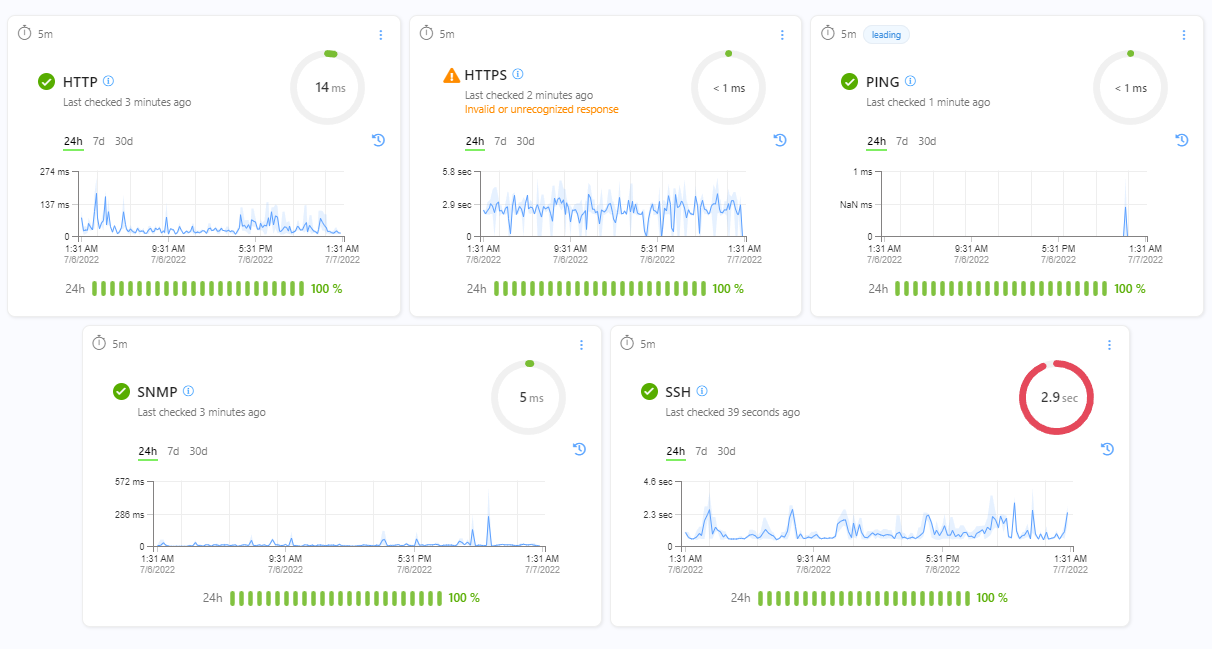
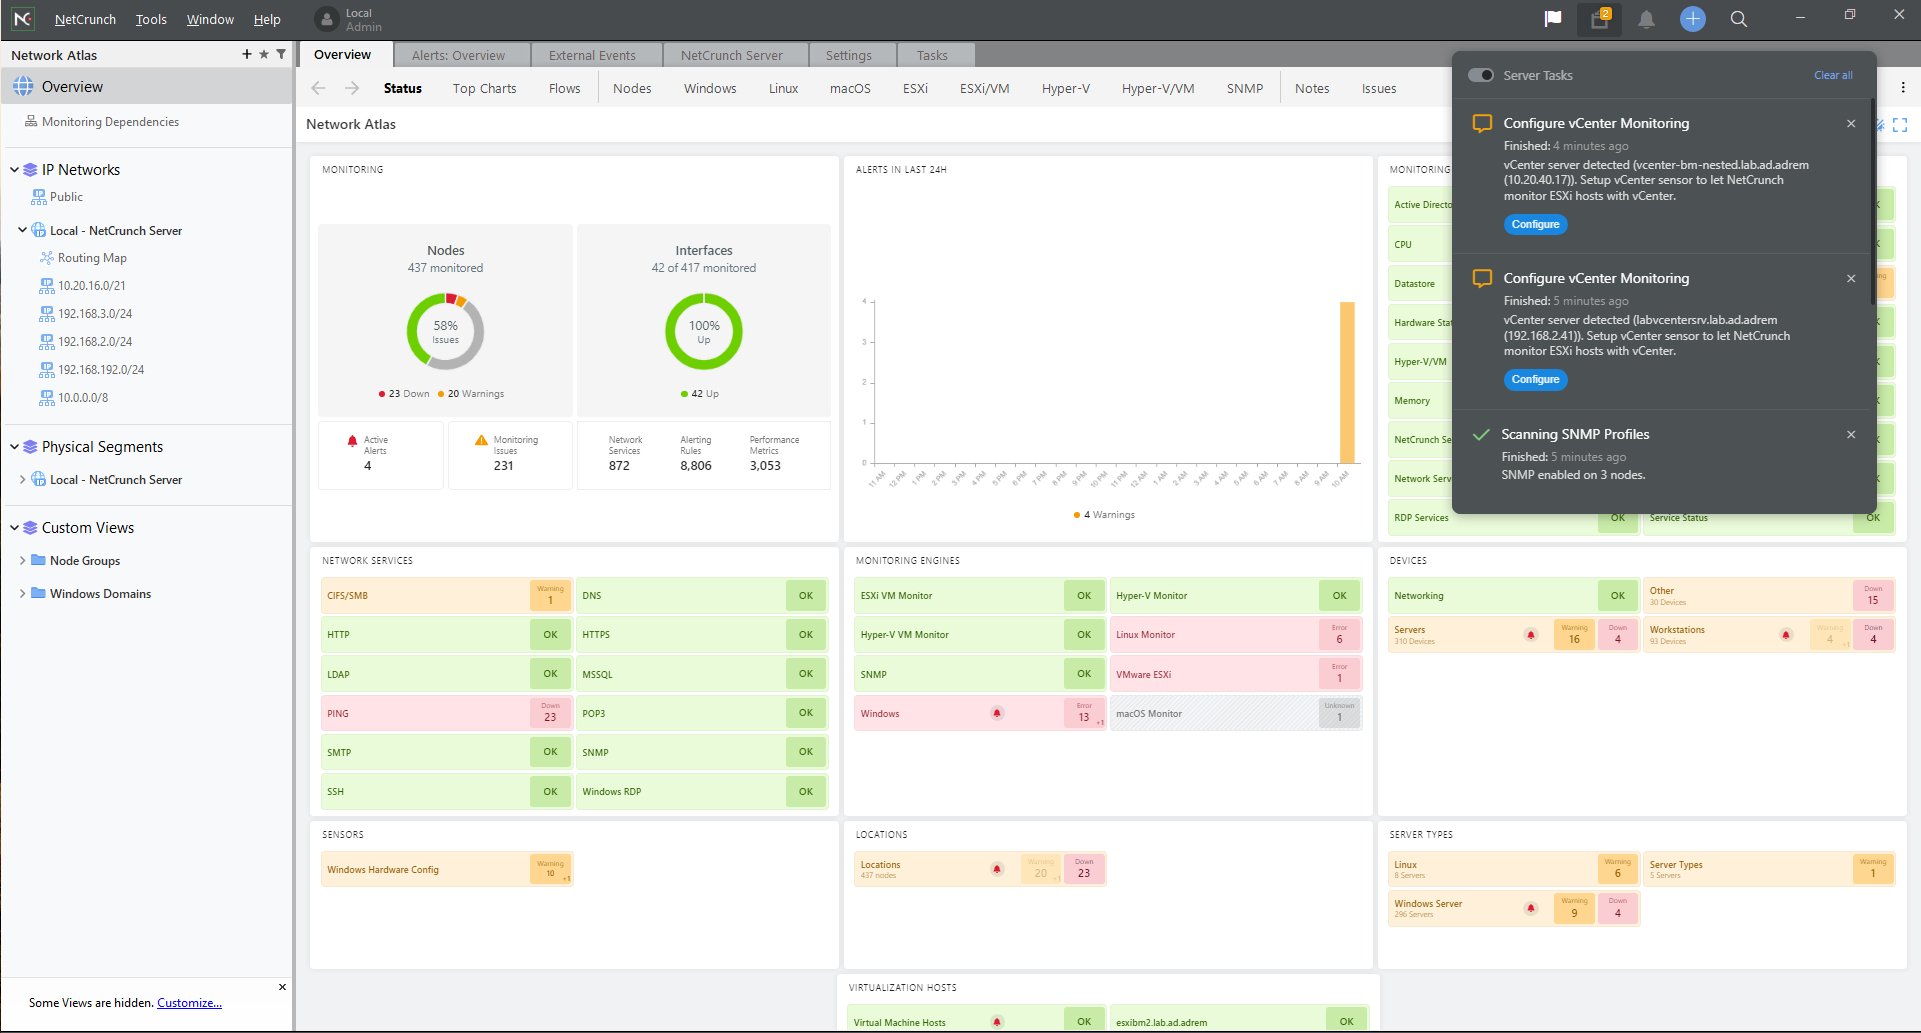
The new 2. Revamped Network Services Status window takes a cleaner approach to present network metrics.
Here, you will see all the services, their performance, and availability (uptime) status, all the data you need.
3. New device config monitor
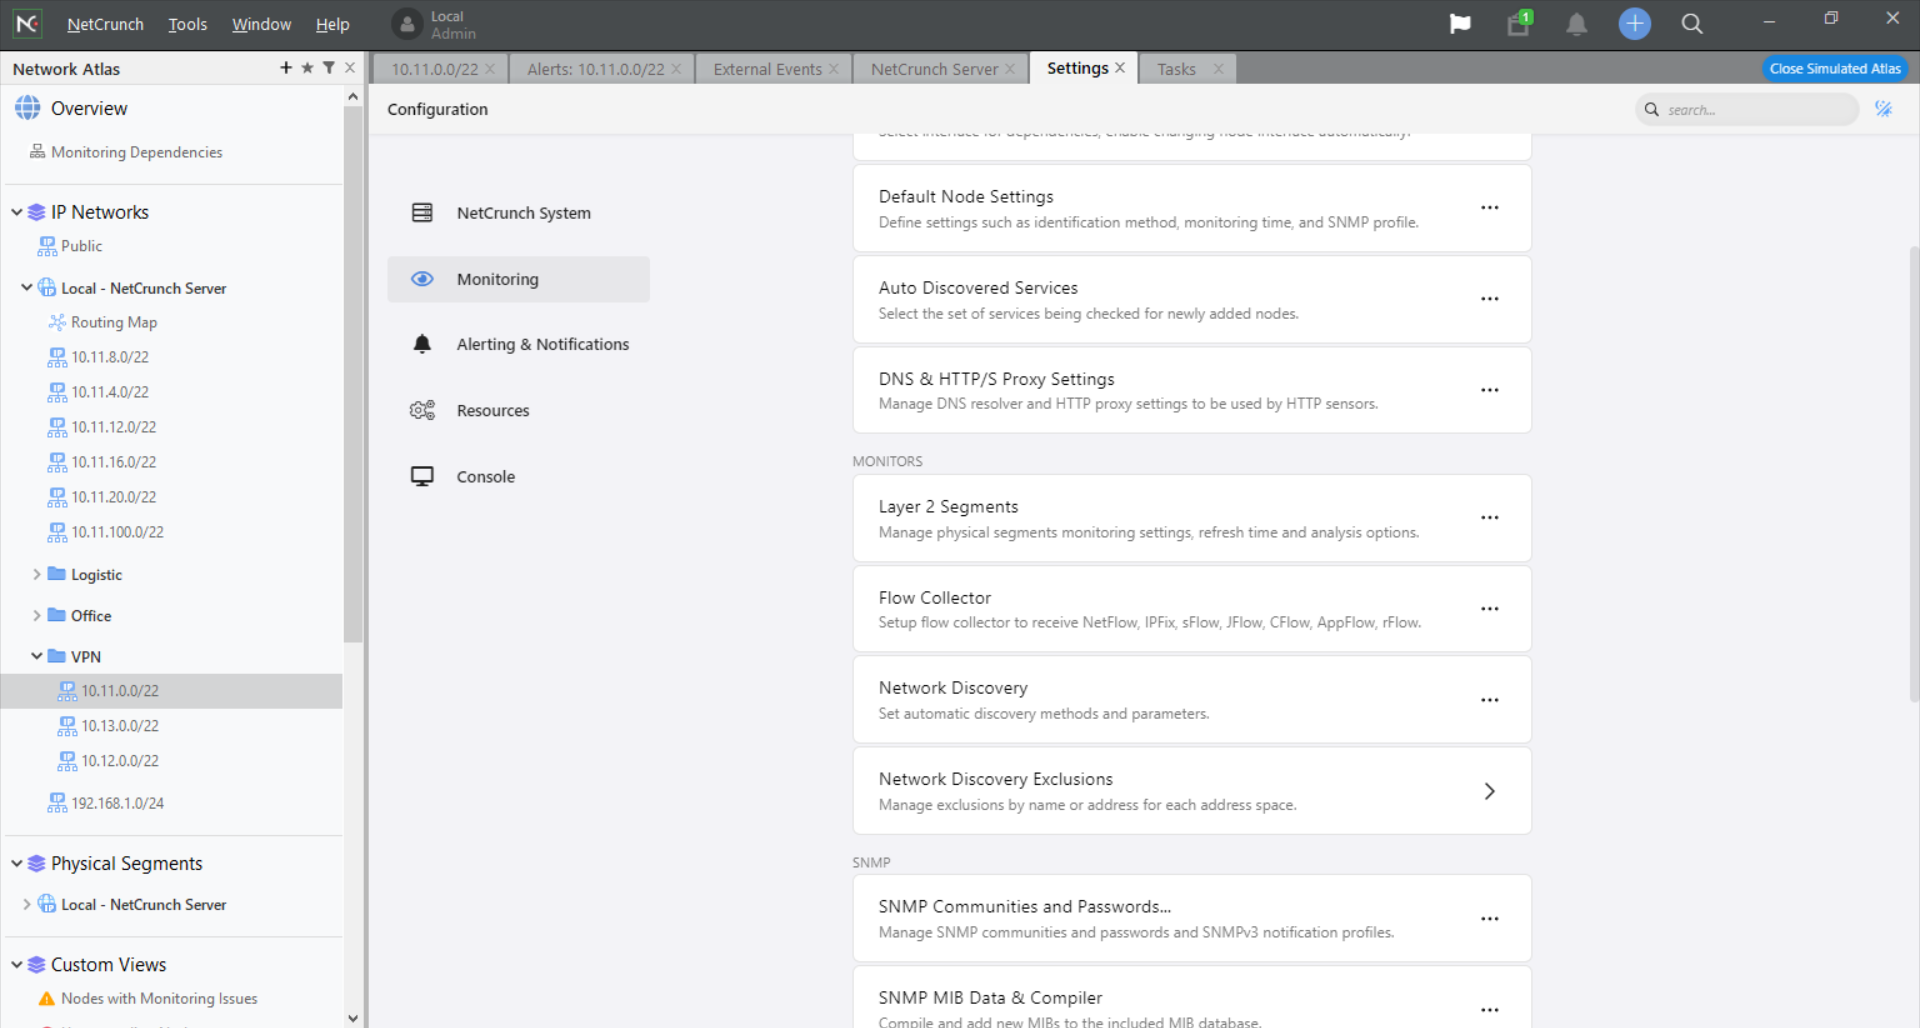
The new device config monitor helps you track configuration changes to detect unauthorized
operations or mistakes and prevent resulting downtime.
It features over 180 profiles out-of-the-box for the most popular devices, plus an easy editor to define new profiles when needed.
In other words, if any of your devices changes its configuration or it’s tinkered with by someone, you will know immediately.
4. New templates for over 30 cloud services
That’s right! Not only you can monitor your physical devices but also provides tracking the performance
of key cloud services used by your business.
That includes Azure and AWS services but also cloud drives, Google Analytics, Microsoft 365 services, and even Zoom.
Basically, NetCrunch provides the best hybrid network agentless monitoring for on-premise local networks and cloud services.
5. New server dashboard
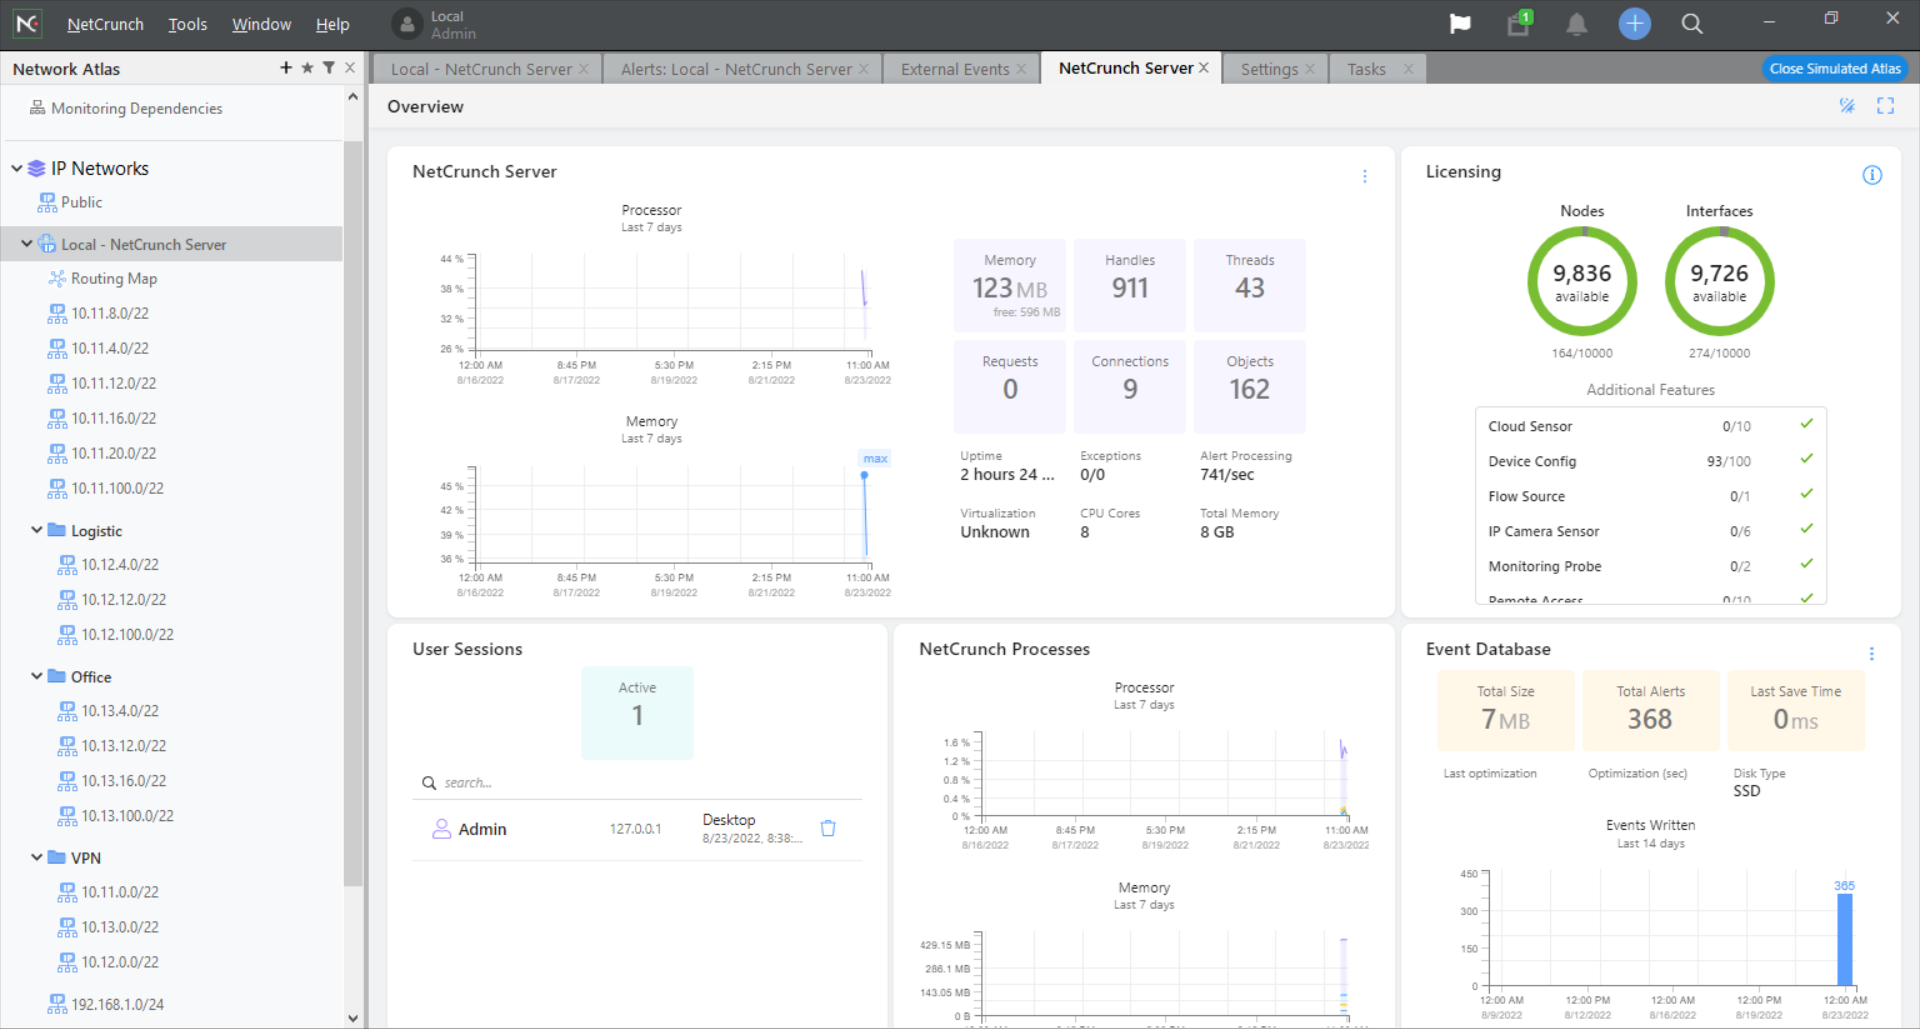
The server dashboard from NetCrunch offers the cleanest and most comprehensive view of any aspect of your monitoring server to make sure that you have allocated sufficient resources to collect and process all your monitoring data.
Of course, the most important part is showing the level of resource usage, including the nodes and interfaces you’re monitoring.
However, the dashboard also shows the event database and if you scroll down, you will also see all the logs.
5. Backup and restore
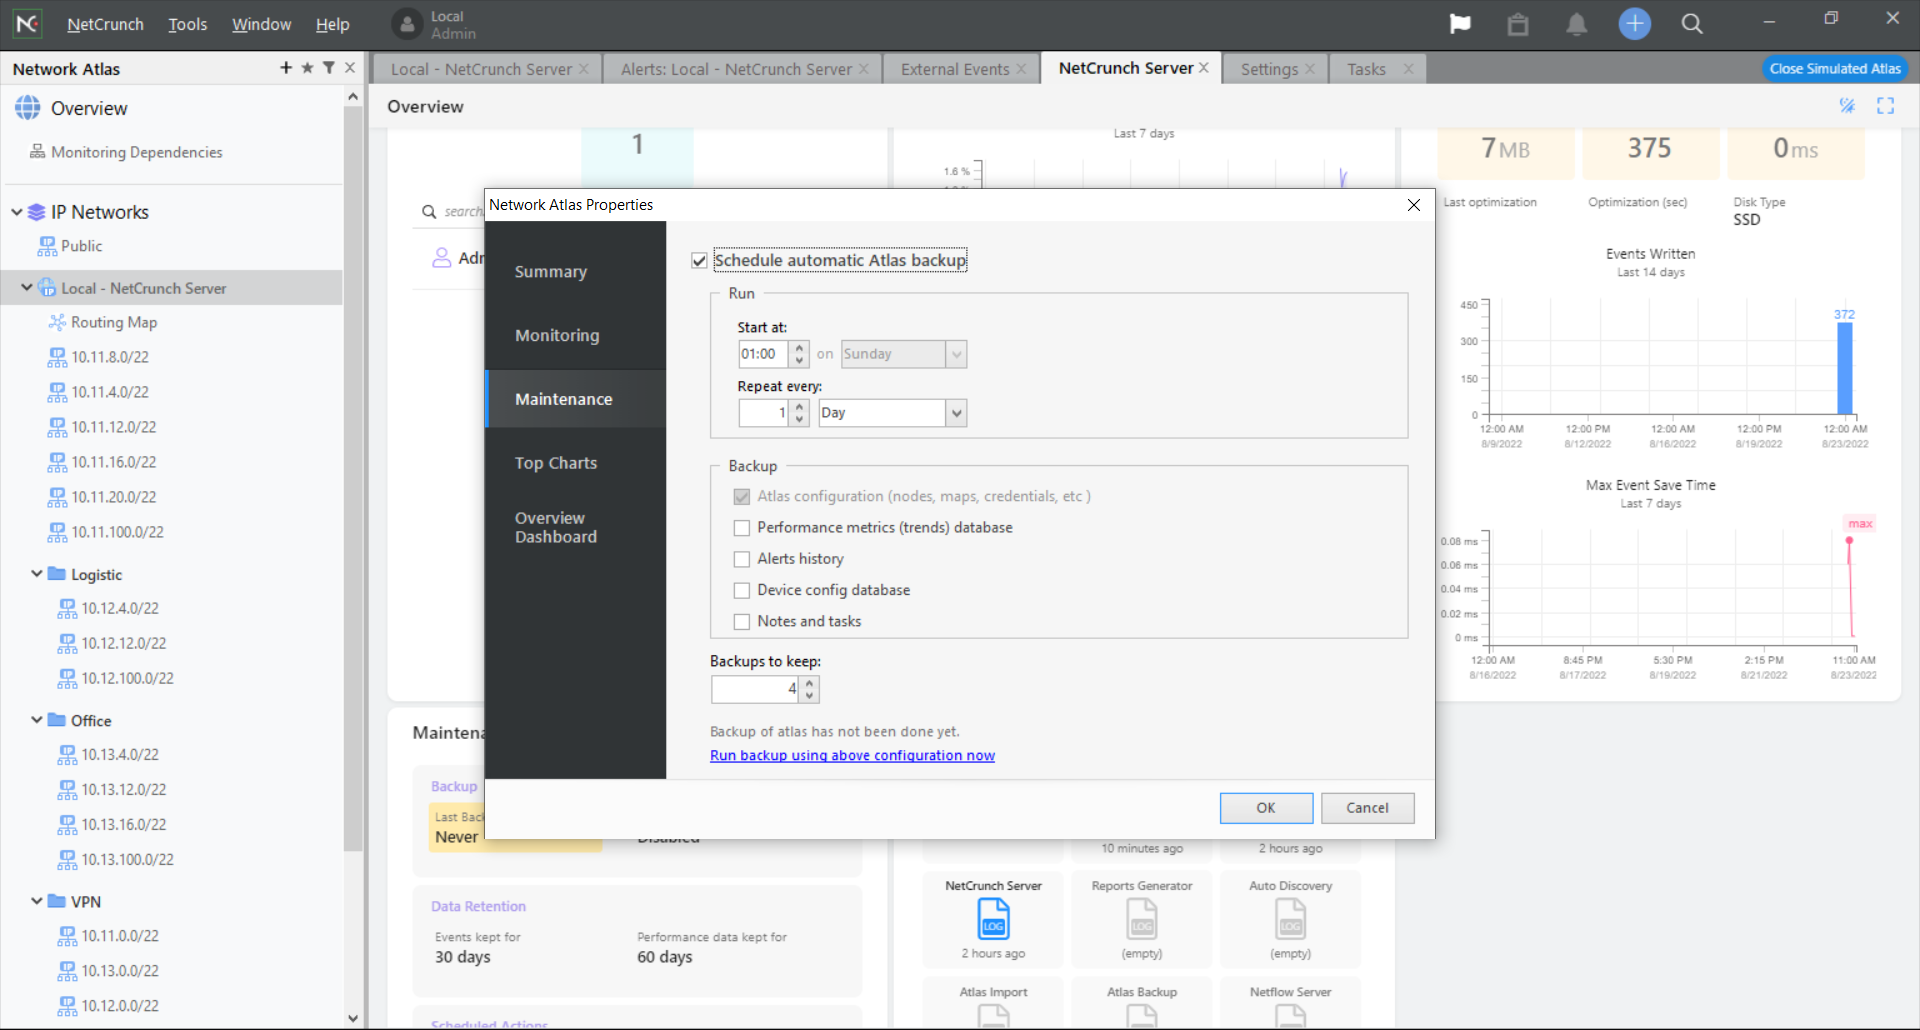
After you configure everything, you may also schedule an automatic backup of the Atlas server.
The backup can be as frequent as hourly and you can choose exactly what to save and how many copies to keep.
In case of a problem, it’s easy to restore the server immediately and have it back as good as new, whenever you want.
How can I install and set up NetCrunch 12 quickly?
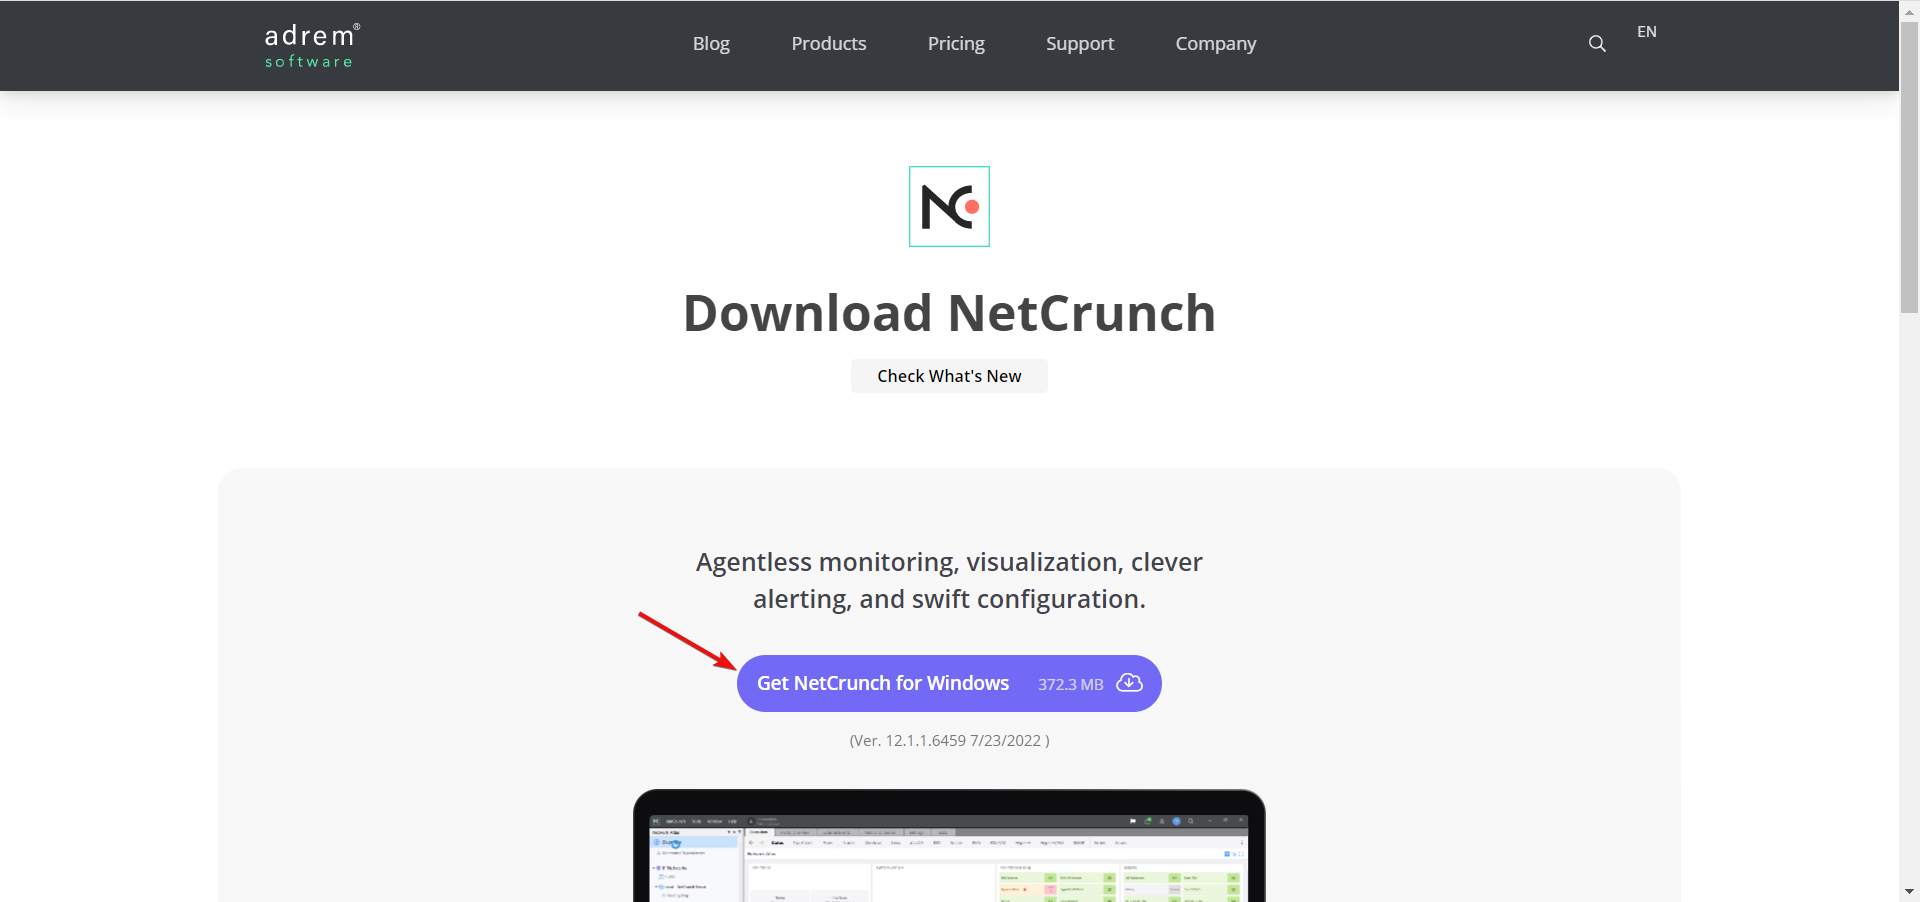
- After you visit the NetCrunch download page and download the software, you can start the installation.
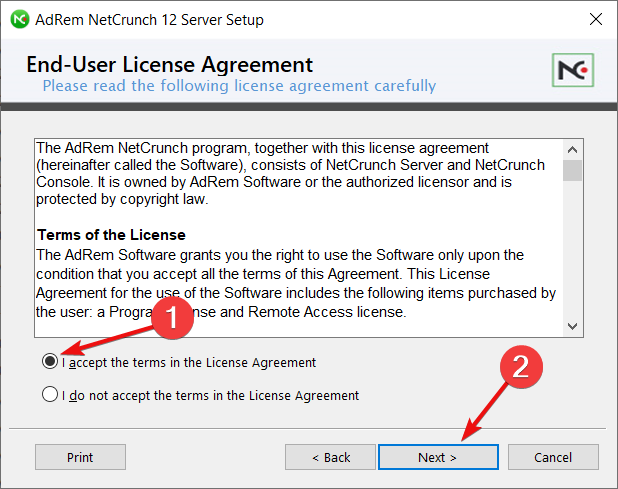
- Read and accept the license agreement, then hit Next.
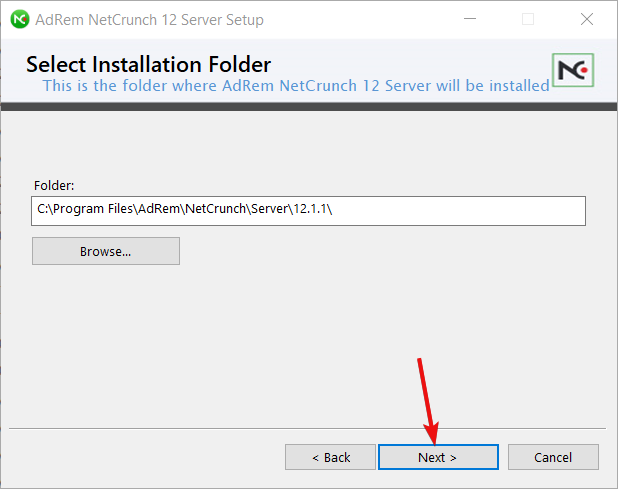
- Choose the path of the installation folder, then click Next.
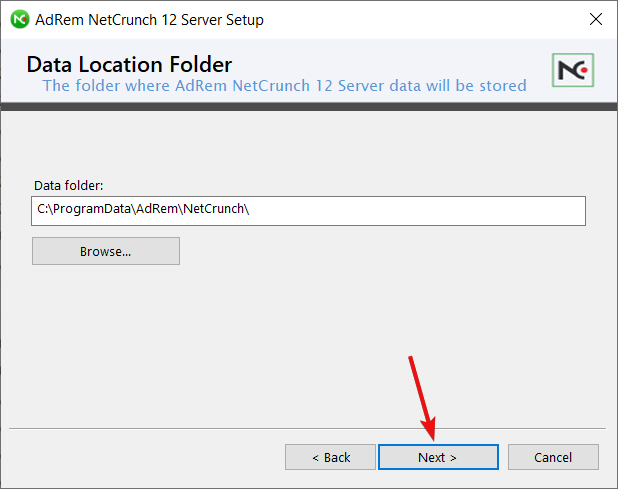
- Now, select the folder where you want to store the server data. By default, the software suggests the ProgramData folder but you can change it with a location on a separate drive.
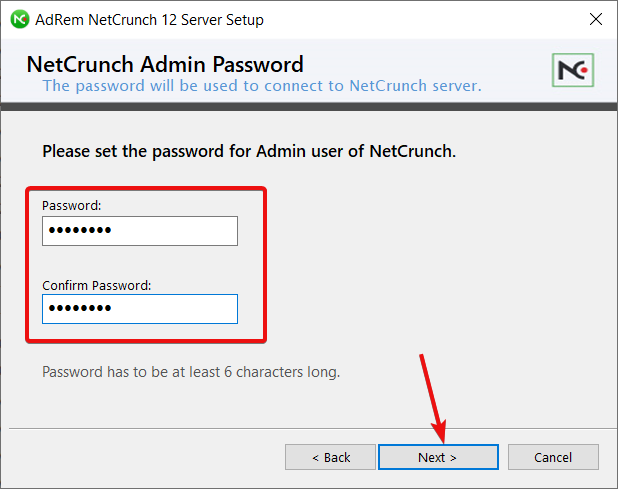
- Next, select a password for the NetCrunch server and hit Next.
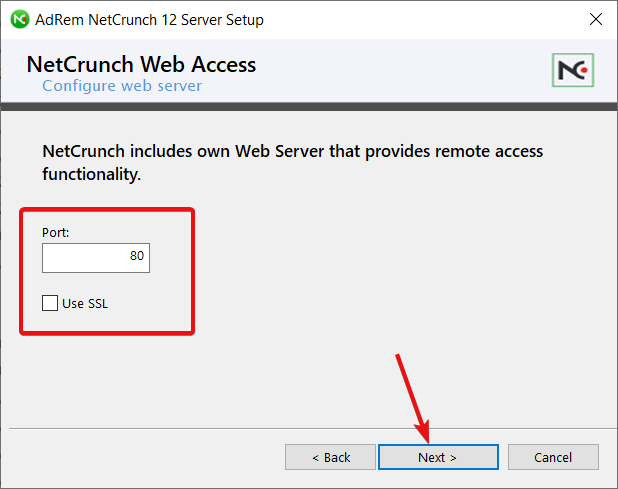
- Select the port for the web server and check the Use SSL box to keep the Internet connection secure.
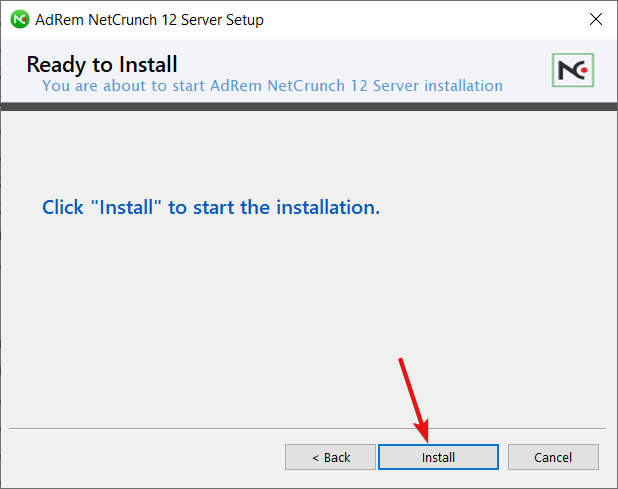
- Finally, hit the Install button to start installing the Atlas server.
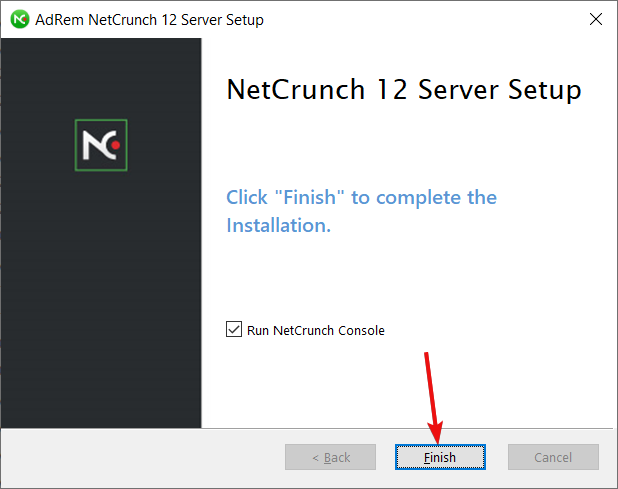
- After a few minutes, the server will be installed. Clicking on Finish will start the NetCrunch Console.
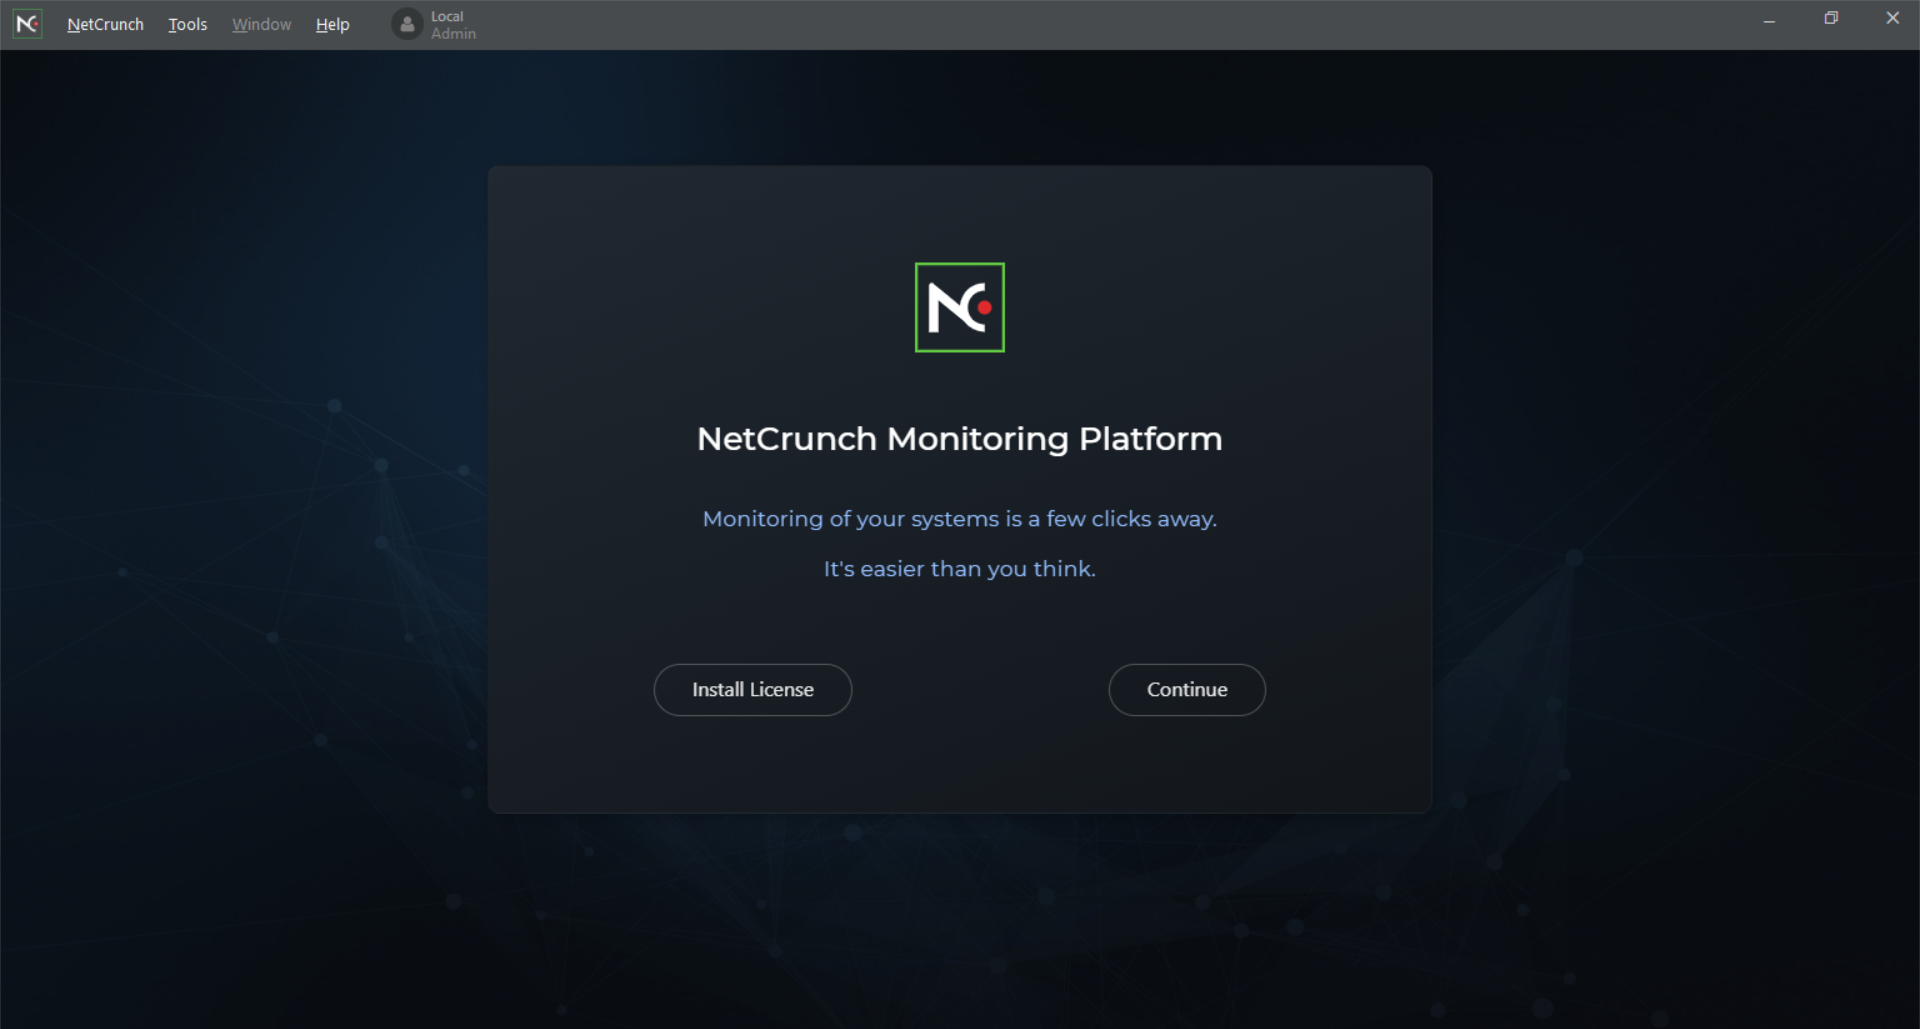
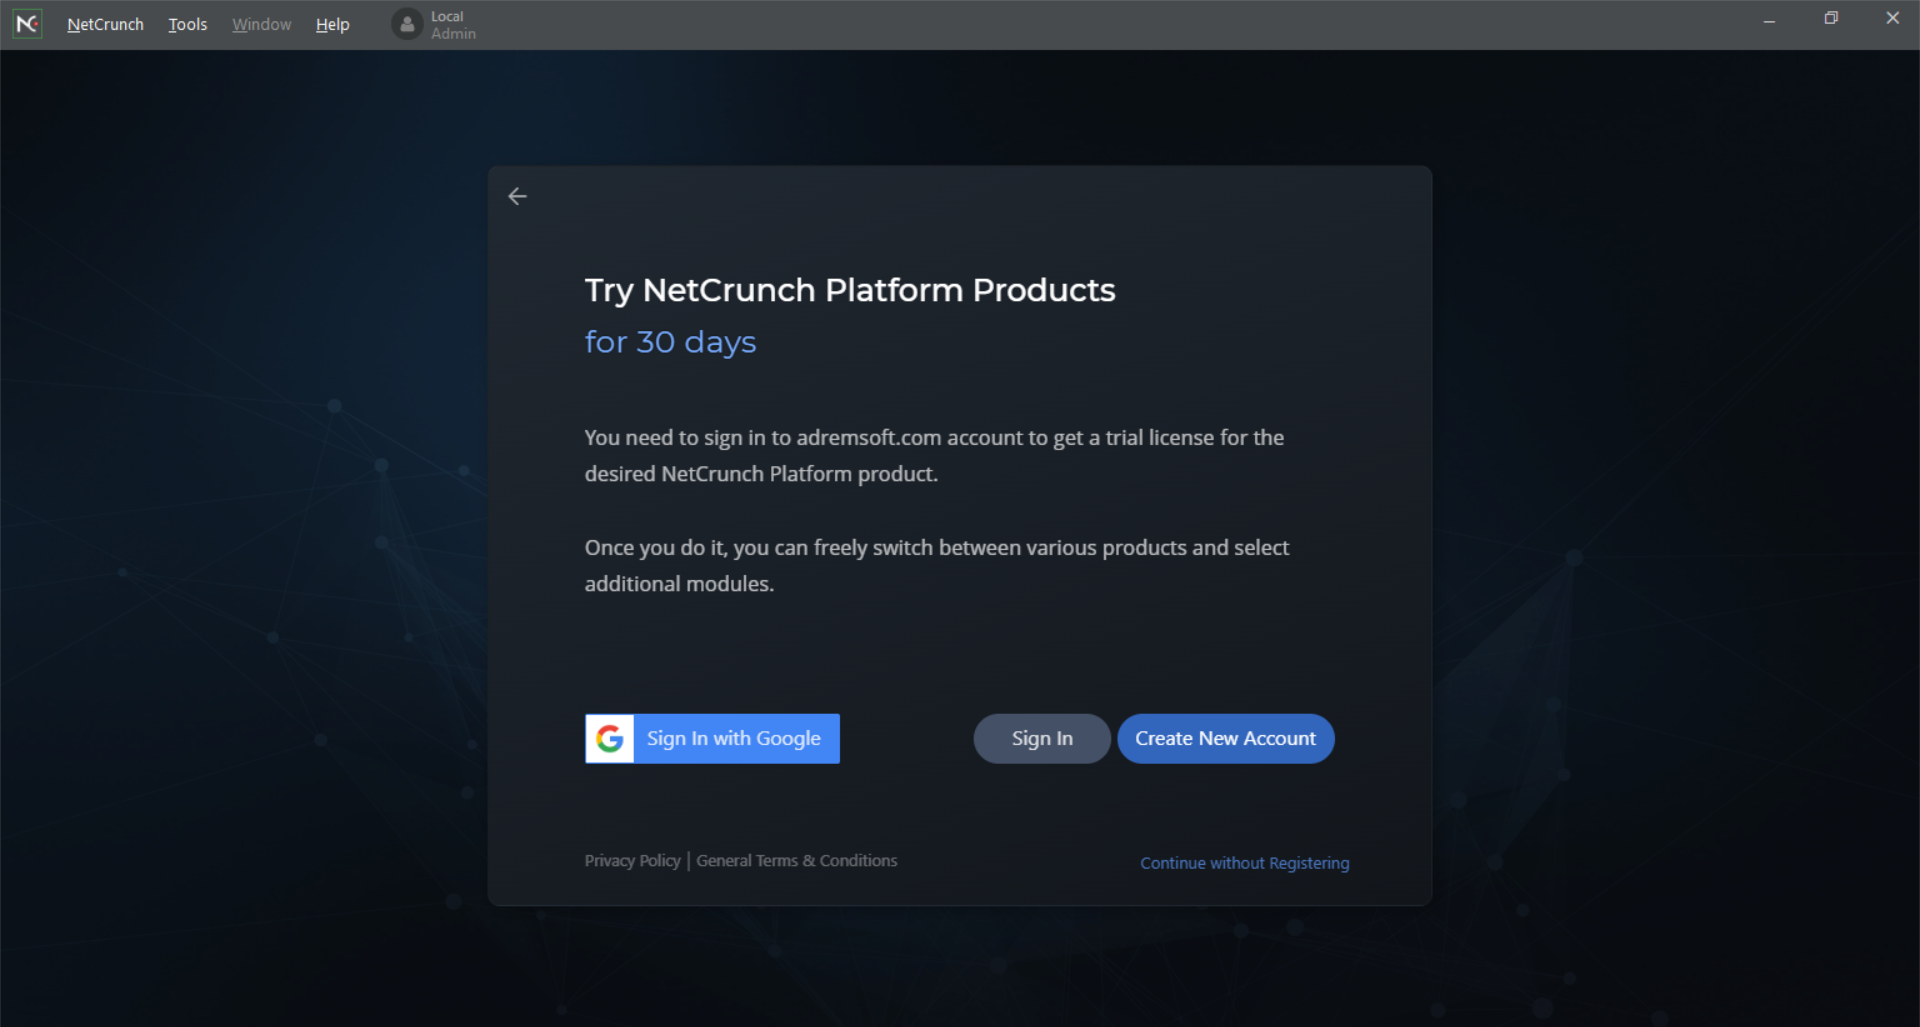
- Now, you can either install a license if you already bought one or hit Continue.
- If you went with the second option, you need to create a new account or sign in with your Google account.
- Now, you will be asked to check which areas you need to monitor.
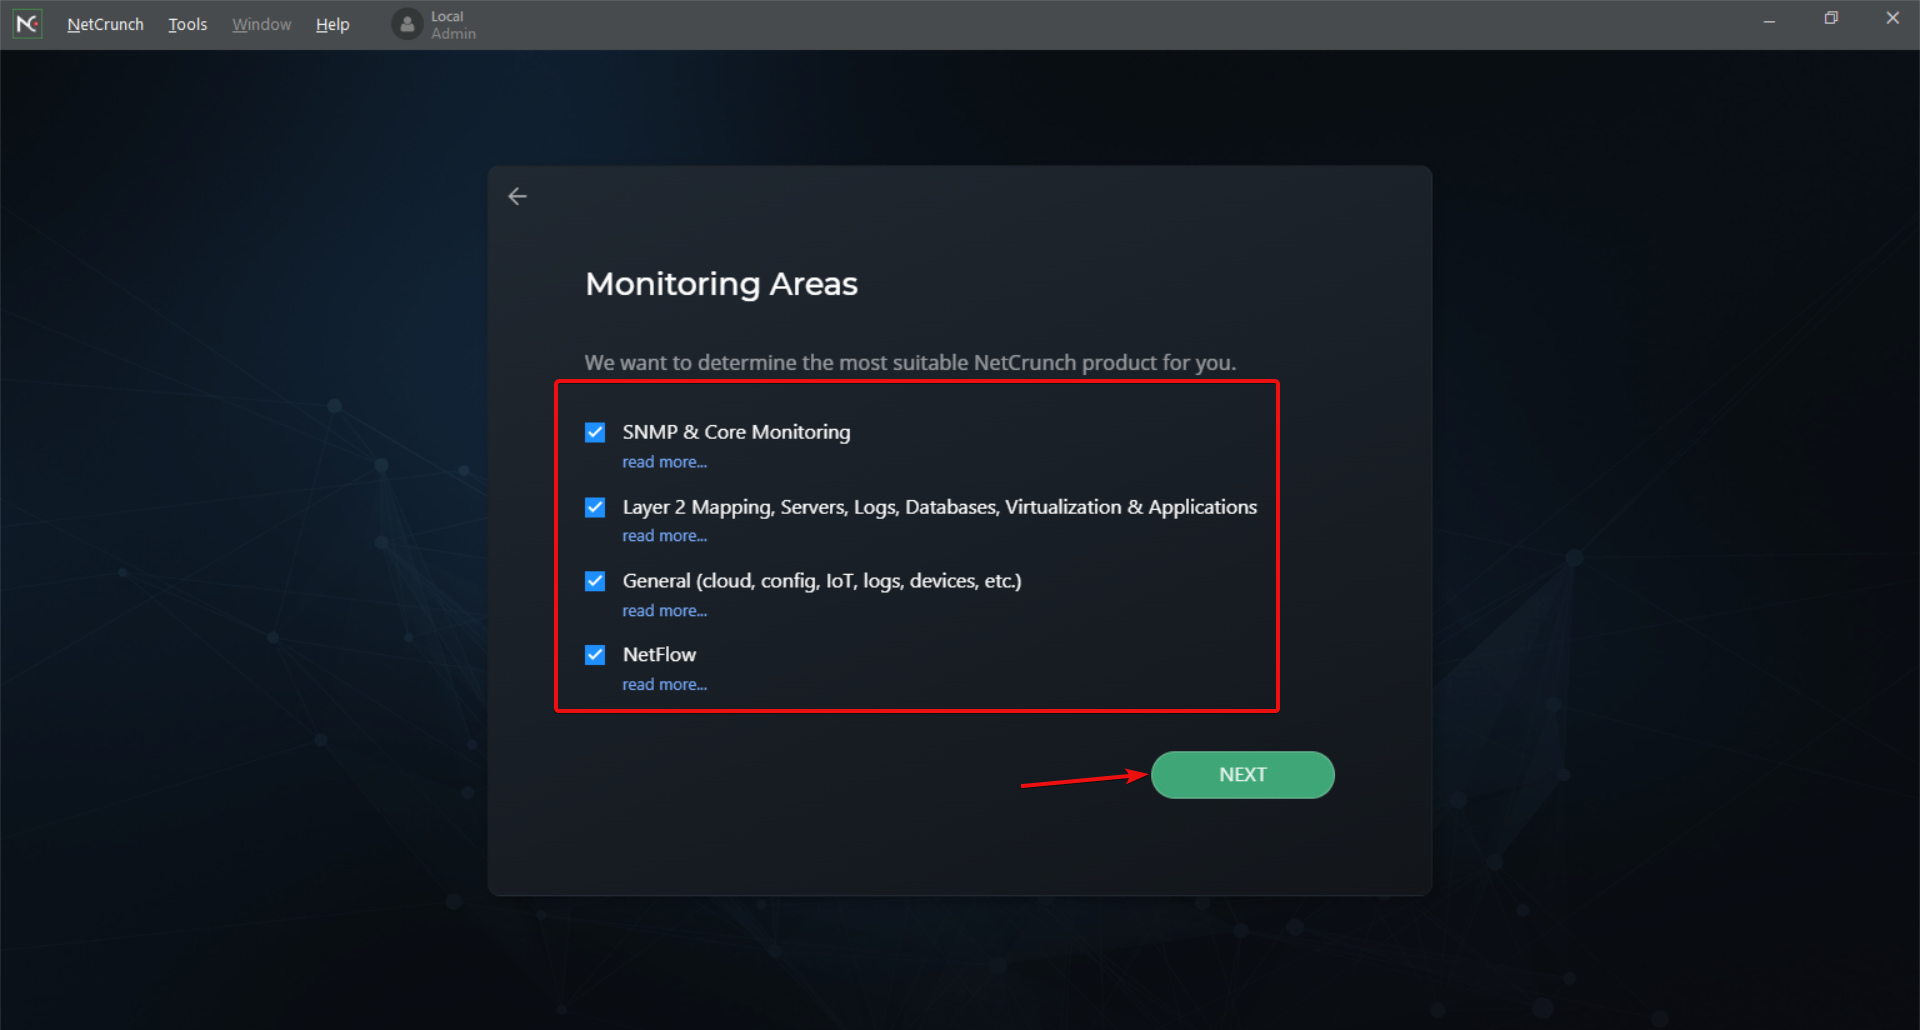
- Based on your selection, you will be recommended a NetChunch plan that suits you better. Because we’ve chosen all the features, we’ve got to test the NetCrunch Enterprise option.
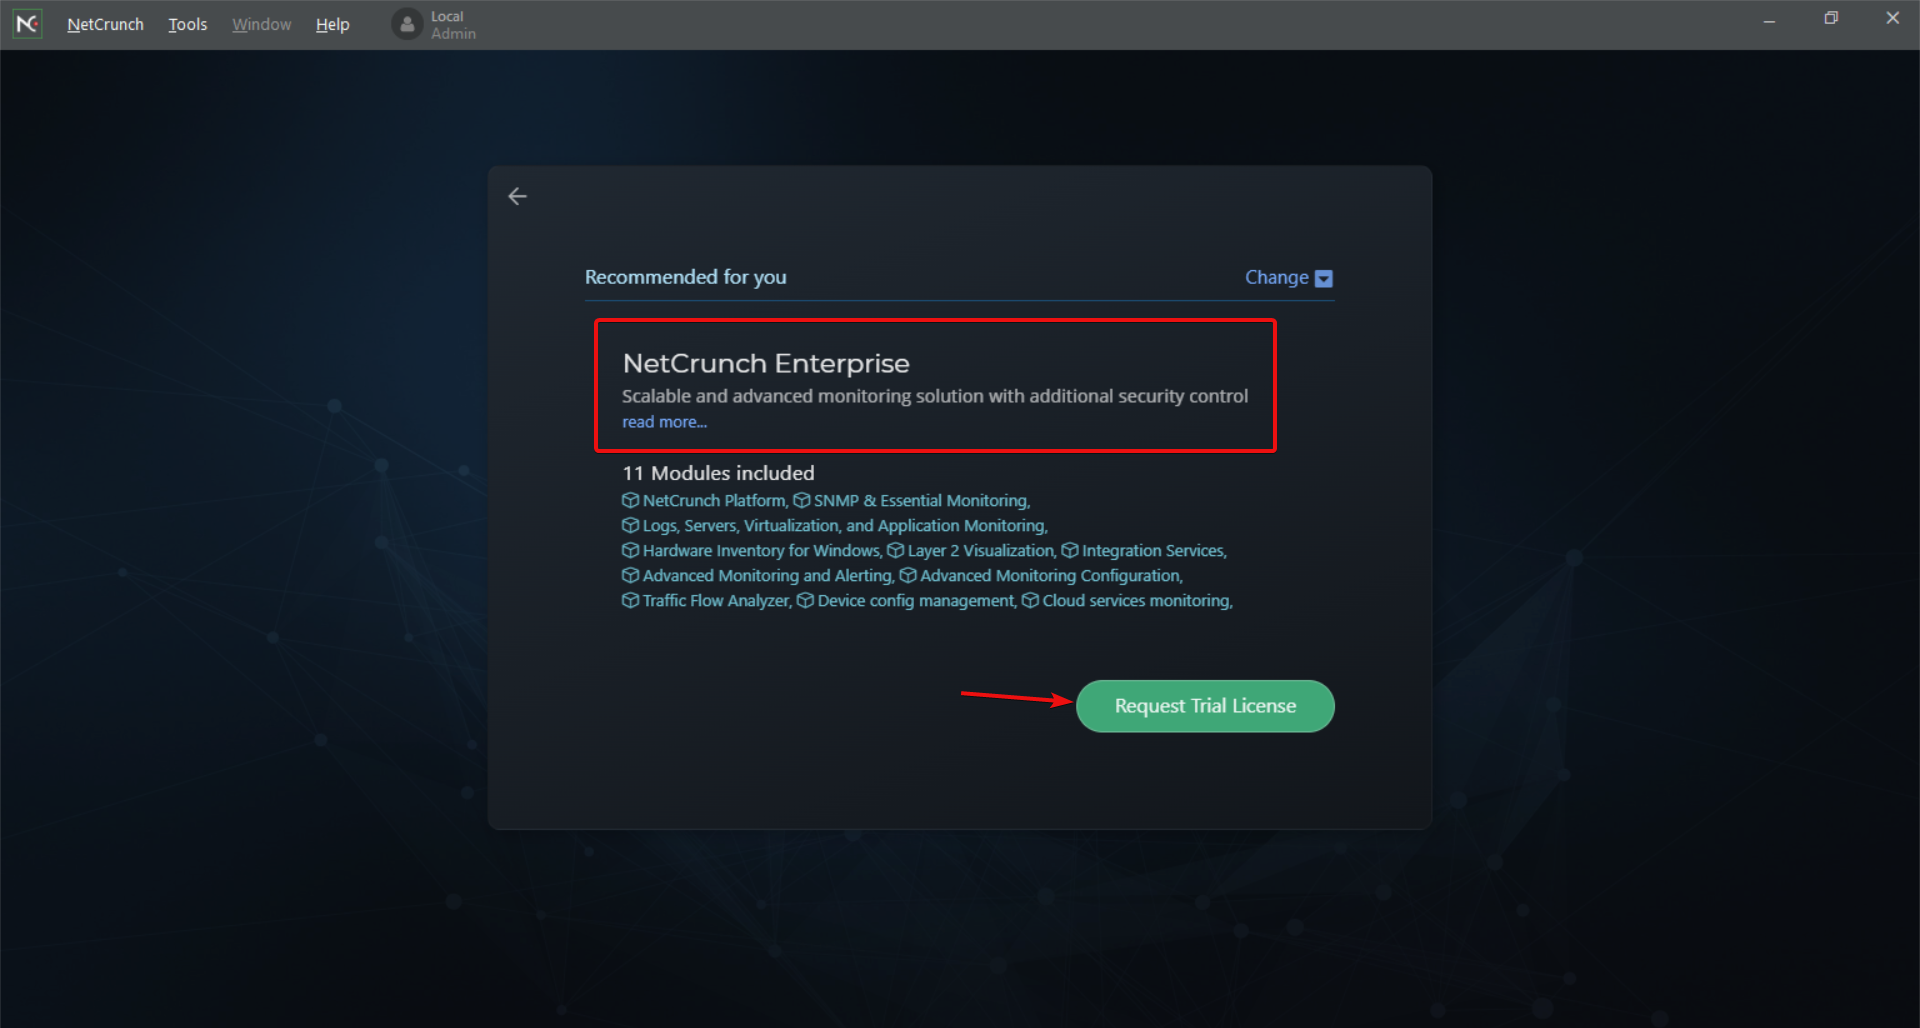
- After a few seconds, the trial license will be activated, and you can now create your own Network Atlas or select Simulated Atlas to open a demonstration Atlas.

How can I create a network Atlas?
- There are two ways of instructing NetCrunch on which elements of your network you would like to detect, add and start monitoring.
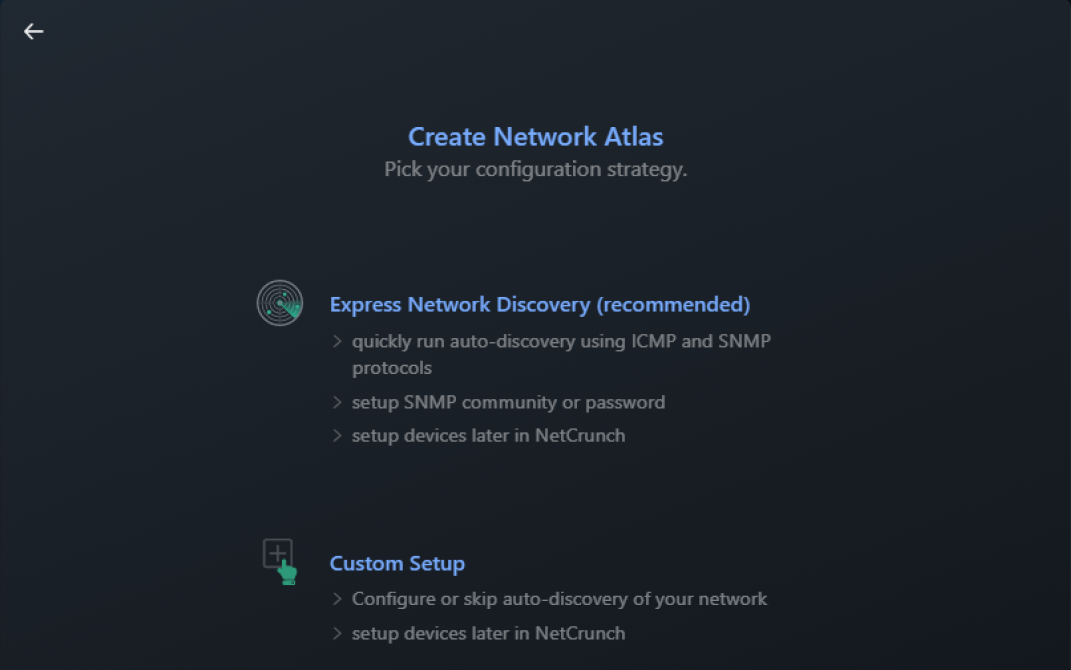
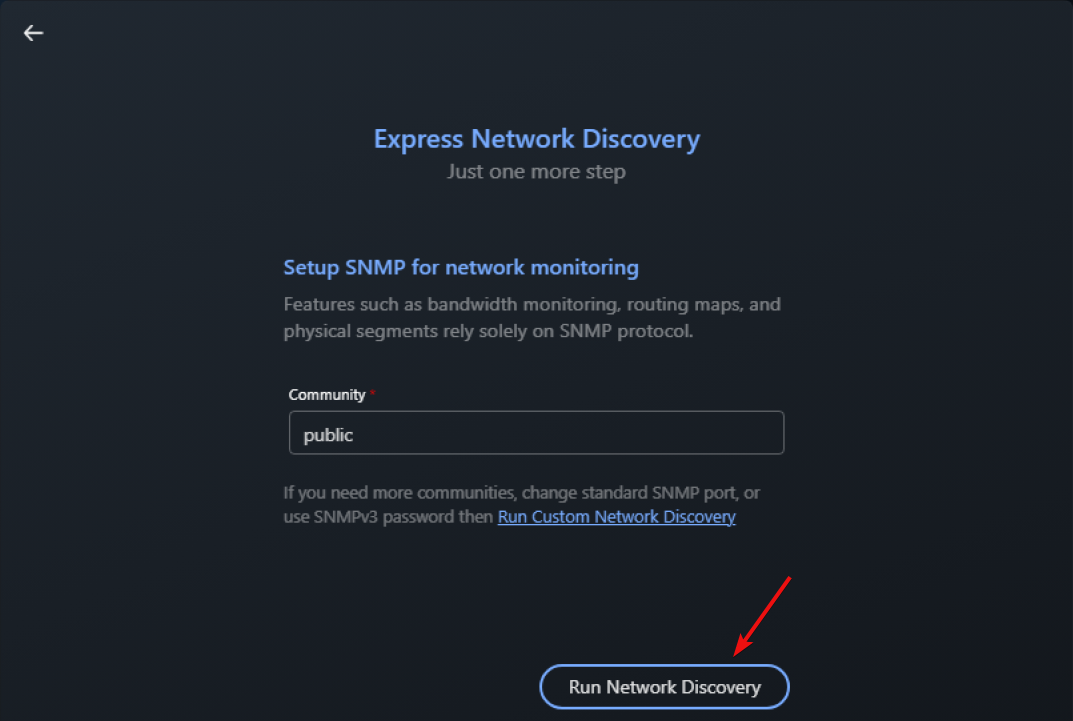
- Network scanning in this option is performed using ICMP and SNMP protocols. Click on Run Network Discovery.
- Initial scanning may take around 1-2 minutes (in our case discovering around 430 devices took 45 s).
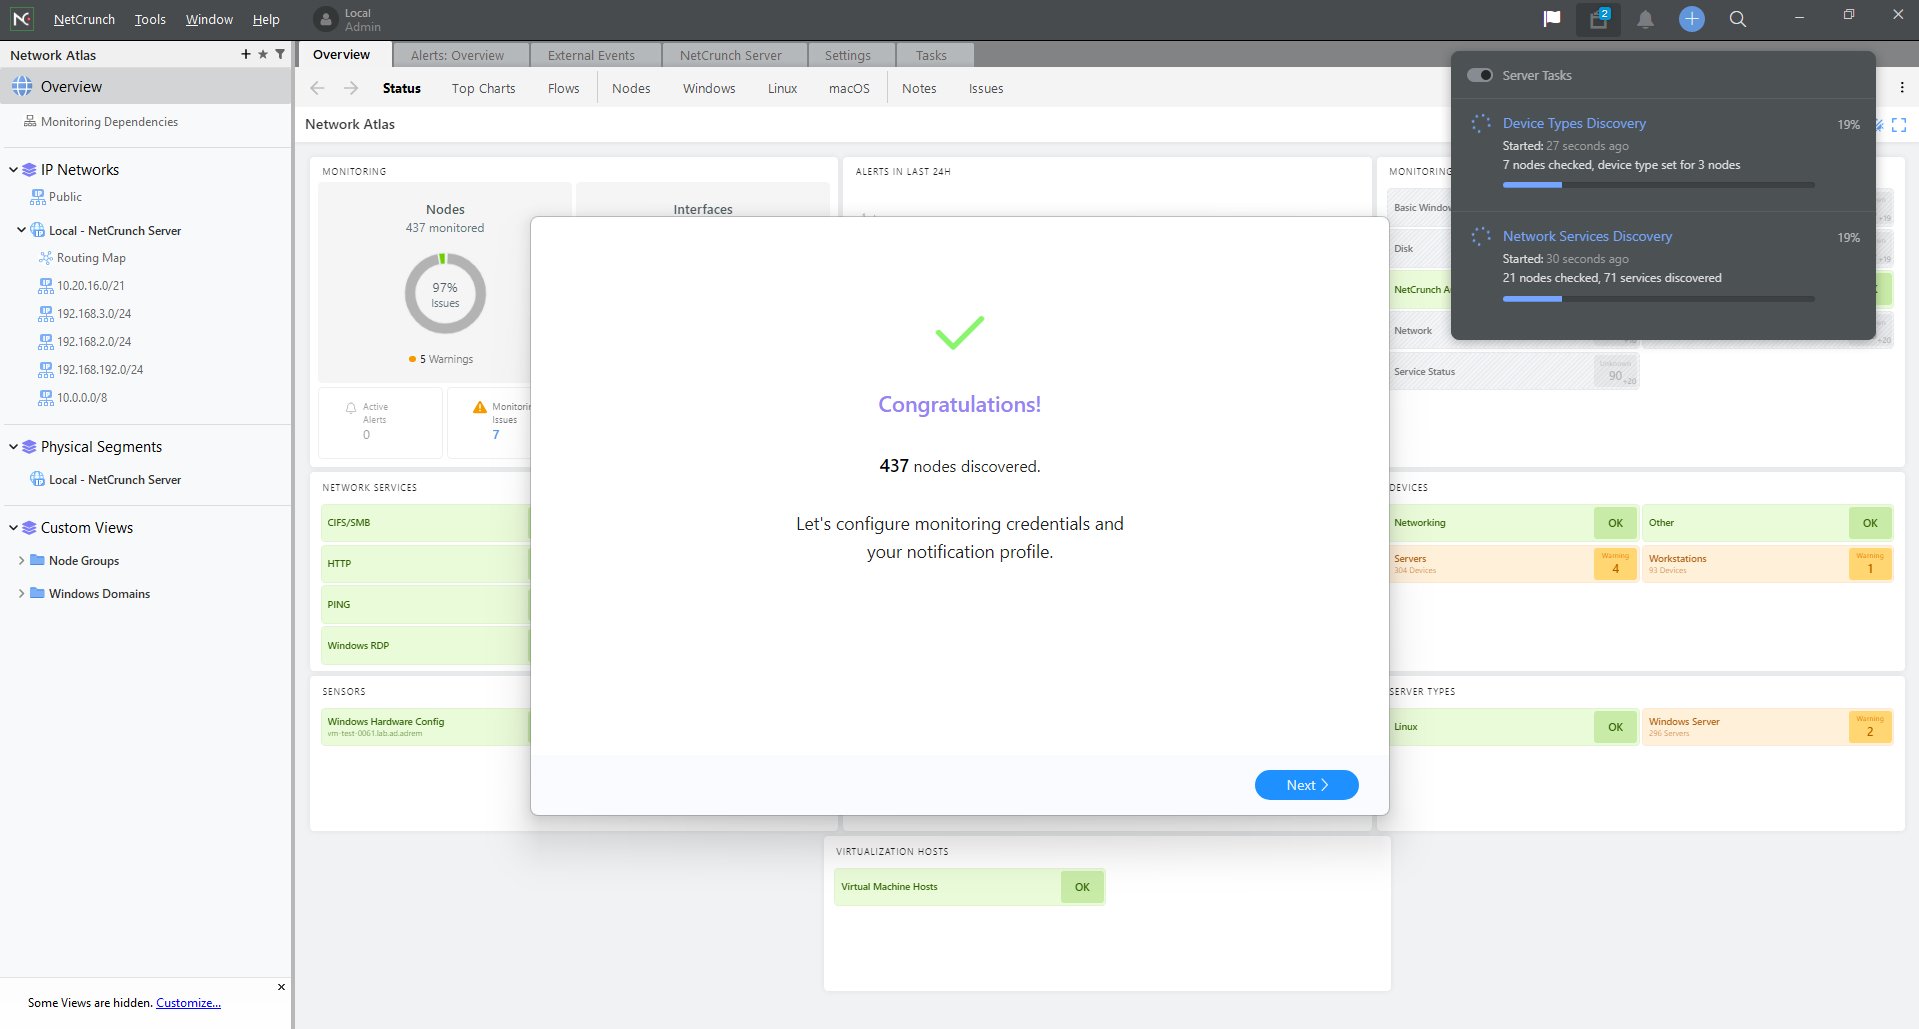
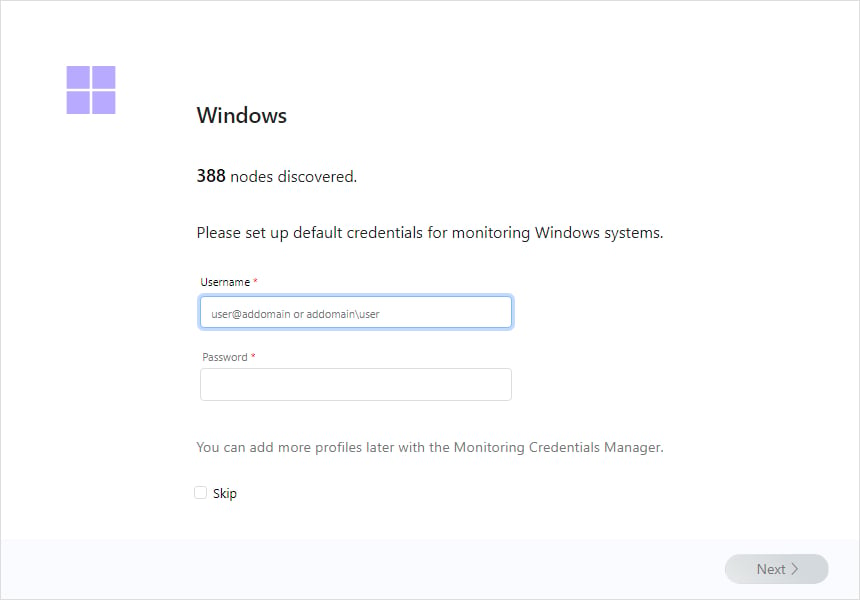
- The next step is to enter credentials to the detected operating systems so that NetCrunch can monitor them.
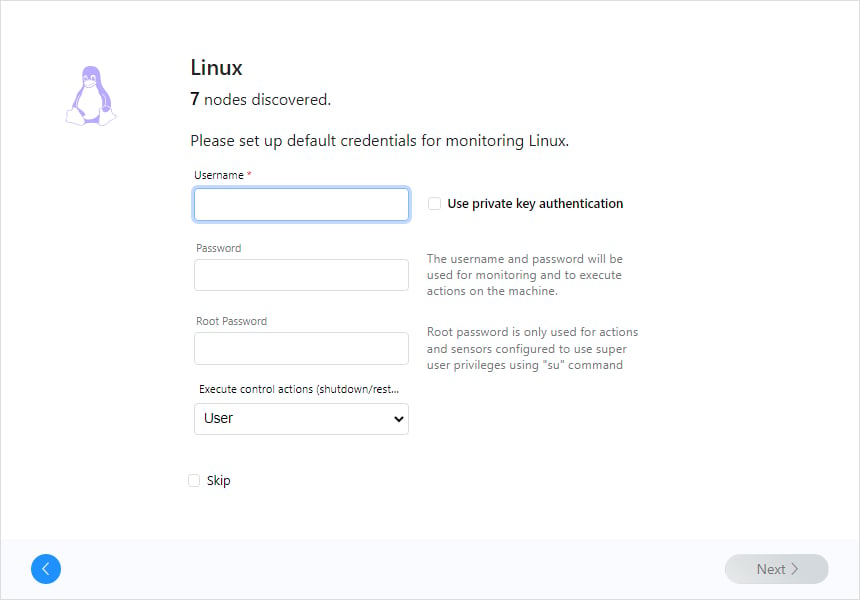
- And if it finds Linux nodes, you will need to do the same for those.
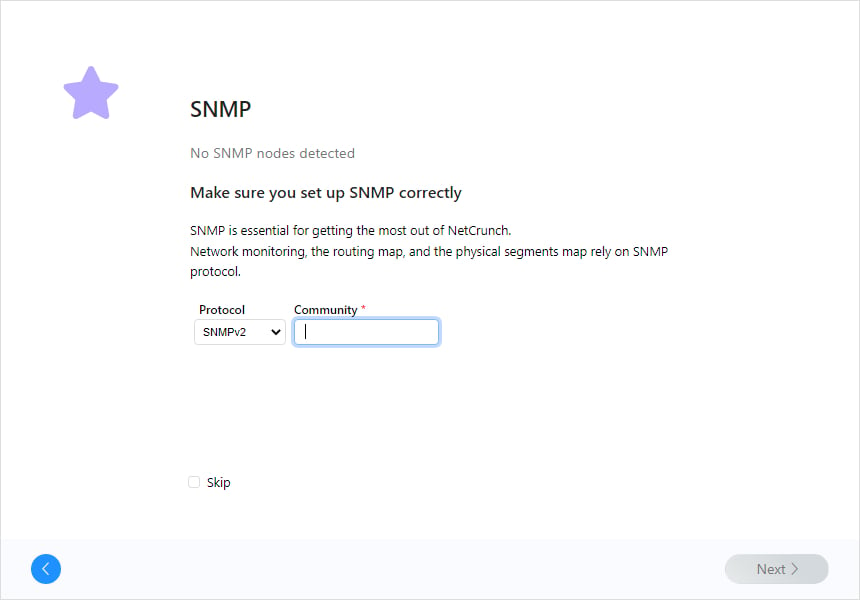
- SNMP is important for monitoring network devices – it is recommended to enter all SNMP communities that are used as it is the fastest way to start monitoring all of them.
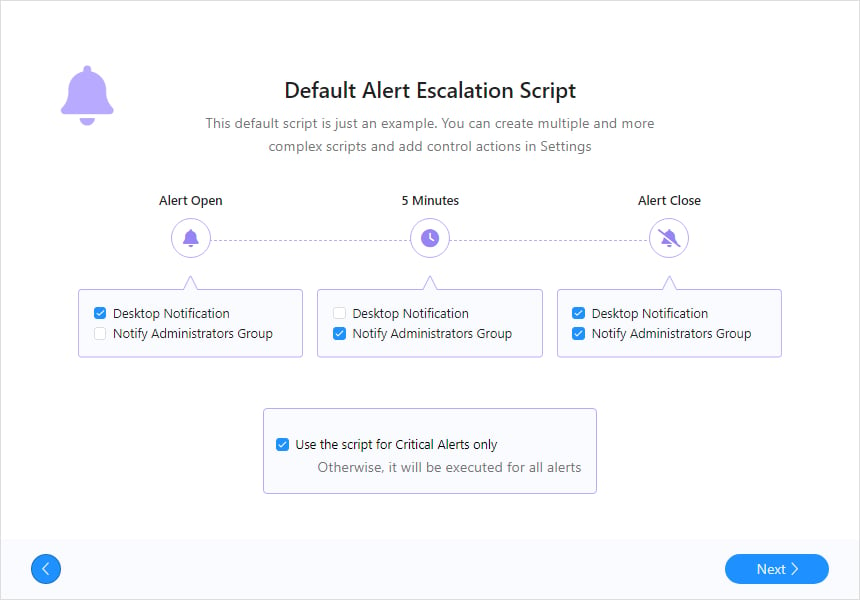
- The final step is to confirm the default alerting script that will be used by NetCrunch in response to any event that you want to track in your network. All events are by default saved to the database and as you can see below, it will display the desktop notifications for critical alerts only.
- Click Finish and it is done.
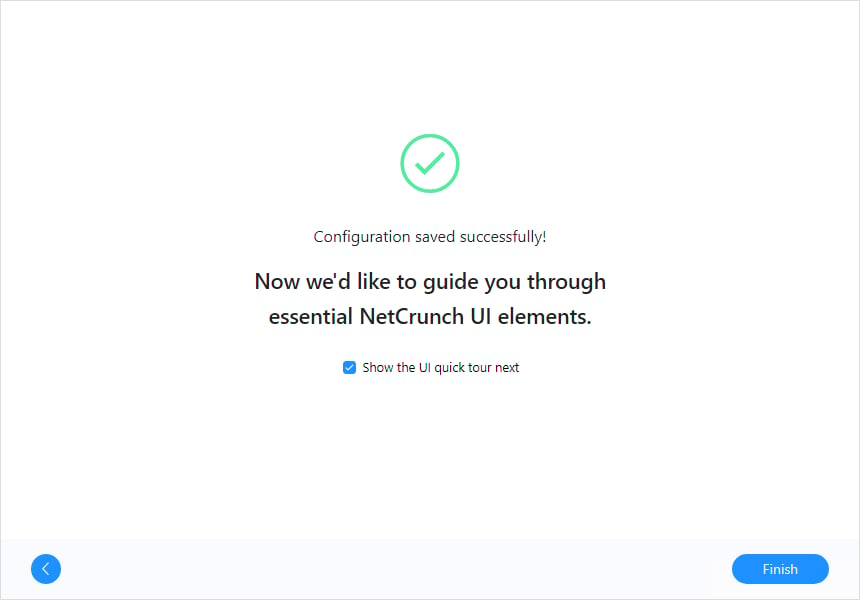
- Now the network is being monitored, metrics are collected and alerts are generated.
- But you can test NetCrunch even if you are not connected to any network by selecting the Run Simulation option when you start NetCrunch Console.
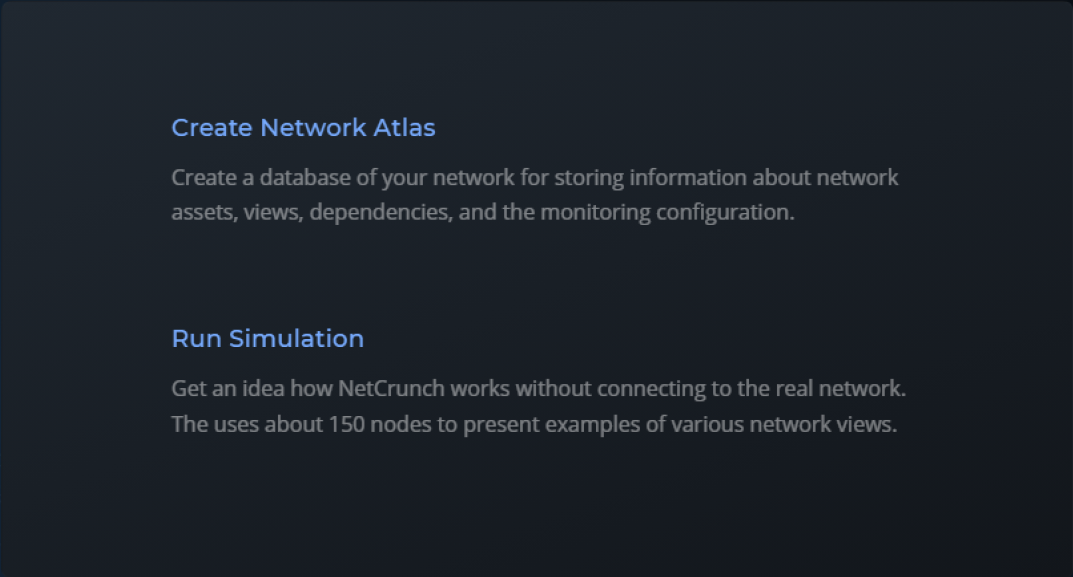
For example, if you are at home or traveling and want to experience what it is like to use NetCrunch for monitoring – you can switch to the Simulated Atlas mode.
It includes a simulated network with devices, traffic, and alerts happening – you can test it, change the configuration of alerts, and tweak anything without worrying that you can damage anything in the real network.
You can close Simulated Atlas if you want to switch back to the real network. You can test NetCrunch in your network for 30 days, but the trial can be extended on request by AdRem.
As you have probably noticed, for a complex monitoring solution like NetCrunch, the installation was a breeze.
Anyway, NetCrunch 12 brings a lot of new features and fixes. We’ve only highlighted a few of them but you can check the full release notes and check out all the new improvements.
We want to add that NetCrunch uses an embedded SQL database for events, so no additional server is required. It also uses separate file-based stores for trends and the program state.
What is the NetCrunch pricing?
Based on the number of nodes and interfaces but also on services, there are three flexible plans:
➡ NetCrunch Essentials
This plan is tailored for clients who need to monitor services uptime, bandwidth, and any SNMP device.
Here are some of its included features:
- Bandwidth Monitoring
- Routing Map, VLAN & Port Mapping
- SNMPv1,2c,3, MIB database & compiler
- 110+ Monitoring Packs
- Uptime monitoring, Cisco IPSLA
- 1 Year Data Retention
- 1 Year upgrades and standard support
- 3 Remote Access Connections
➡ NetCrunch Professional
This is a comprehensive package with hundreds of monitoring targets for your extensive needs.
Here are some of its included features, on top of the essentials:
- Servers & Virtualization Monitoring
- Layer 2 Maps
- Log Monitoring (Text, Syslog, Traps, etc.)
- 260+ Monitoring Packs
- 130+ Sensors (WMI, IPMI, SQL, etc.)
- Advanced Conditional Alerts
- Active Directory Integration
- 1 IP Camera Sensor
➡ NetCrunch Enterprise
It is the complete plan, with all the services needed for organizations. It features additional security control and support.
Here are some of its included features, on top of the ones in the Professional license:
- Flow Analyzer (NetFlow, sFlow, etc.)
- Log Analytics
- Activity Log
- Smart Monitoring Templates
- Business Status Node
- Unlimited Data Retention
- 1 Monitoring Probe
- 10 Remote Access Connections
- 10 Cloud Sensors
- 100 Config Sensors
All you need to do is to figure out what are your exact needs and choose the right plan for your business.
- Pros
- Simple and comprehensive user interface
- Over 650 monitoring templates
- Monitors all your networking and cloud services
- One dashboard for all networking activities
- Easy to install and set up
- No need to install monitoring agents
- Backup and restore your Atlas server
- Cons
- No cloud-based app
Closing notes
NetCrunch is by far the best network monitoring tool we’ve come across until now. And that’s mostly because it does the mapping and monitoring without any need for agents.
Most other such solutions are time-consuming just because you need to install monitoring agents on your devices.
Not only that, but NetCrunch offers unparalleled support for any device with an IP but also cloud services.
And in its latest version, NetCrunch 12 offers support for over 180 popular devices, all ready to use.
To top it all, the backup and restore feature ensures that all your rules, policies, and settings are stored safely every time.
That being said, we recommend testing this tool for 30 days without any credit card required and convincing yourself.
You might also be interested in our list including the best network log event viewer tools to get other suggestions.
Did you try NetCrunch already? Tell us about your experience in the comments section below.
Read our disclosure page to find out how can you help Windows Report sustain the editorial team. Read more


Improve this guide

User forum
0 messages