5 Best SAP & BI Reporting Tools [Top Brands Reviewed]
SAP and BI software will help you boost your productivity and business
Key notes
- SAP report tools have evolved constantly across time, offering a wide range of useful features.
- Using the right SAP reporting tools will surely help your business be more organized, thus improving productivity.
- Efficiency in using SAP payroll reporting tools is paramount, especially if you run a big company.
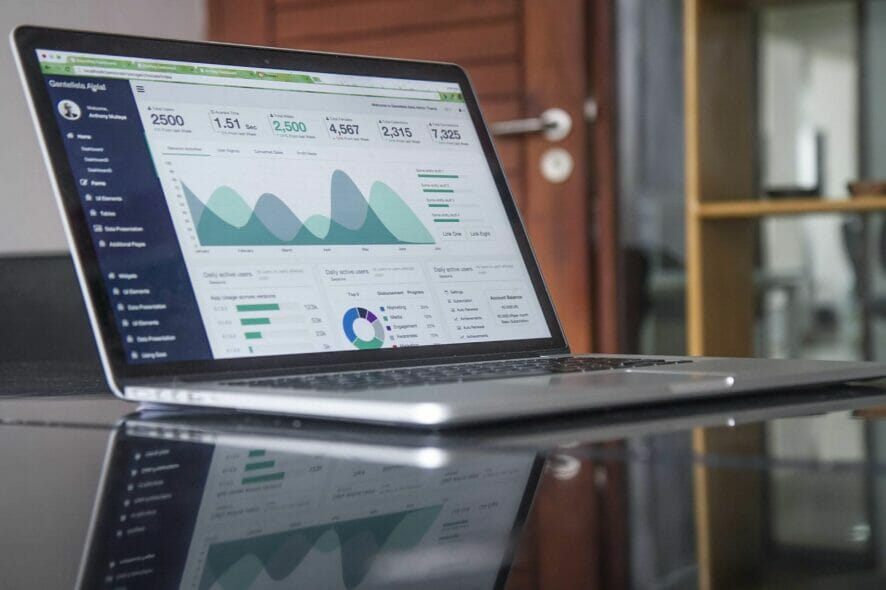
If you are thinking of implementing a BI (Business Intelligence) reporting & SAP tool, these apps will help you understand trends and derive insights from your data.
However, the larger question is how does one know which business intelligence and SAP reporting tool to use to achieve their goals?
Why do I need SAP & BI reporting tools?
From the latest studies, 64% of businesses that self-service platforms get a substantial competitive advantage. However, 87% of businesses don’t use BI reporting tools.
To use Business Intelligence tools, one need not be an advanced analytics specialist. Since they can be used by anyone, all you have to do is find the right solution that fits your requirements.
In this article, we explore the best SAP & BI reporting tools that are robust and offer integration capabilities to help make the right decision for your business.
What are the best SAP & BI reporting tools available?
ZOHO Analytics – Powerful data analytics capabilities
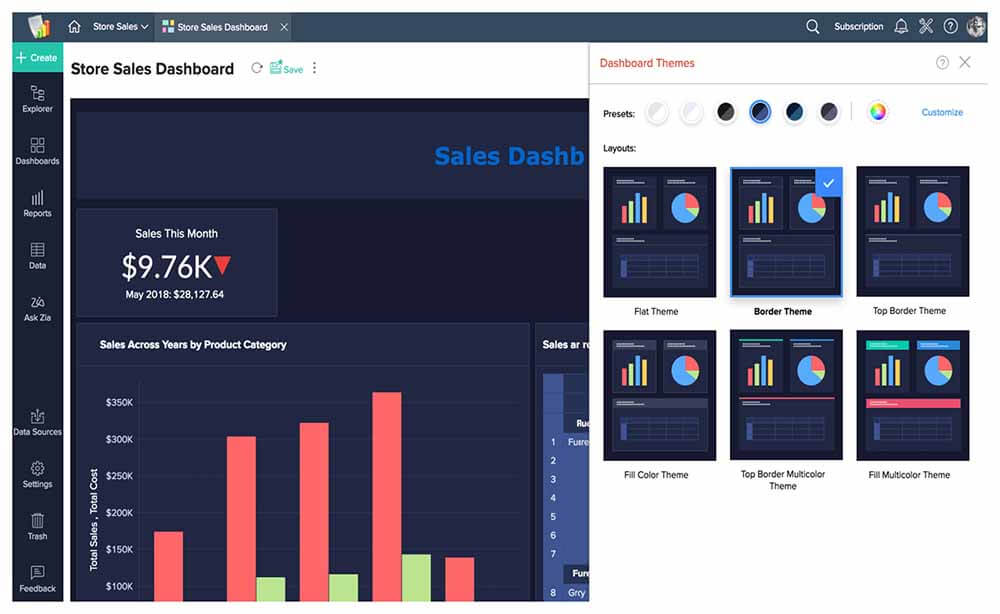
ZOHO Analytics is a data integration platform that enables businesses easily connect with popular data sources such as spreadsheets, databases, cloud applications, and more.
It comes with more than 40 types of charts, tables, pivot tables, and creative interactive dashboards with customizable visualization.
This data preparation tool allows users to clean, transform and enrich their data. It also offers the data manipulation functions, such as filtering, aggregation, and data merging.
ZOHO Analytics provides AI-powered insights that automatically detect patterns, outliers, and trends in data, making it easy for users to discover hidden insights and make data-driven decisions.
This tool has robust collaboration features, allowing teams to work together in real-time, share data, and collaborate on reports and dashboards.
With the Zoho Analytics Mobile BI app, you can access the data, view dashboards and reports & collaborate with your team on the go.
The Data storytelling feature of the platform enables you to raw data into meaningful insights by combining data, narrative, and visualizations to create an engaging story.
Here are some of its most notable features:
- Integration with business tools, including Salesforce, Google Analytics, and more
- Various sharing options, including email and public links
- Provides role-based access control
- Advanced predictive analytics capabilities to forecast trends
- A user-friendly drag-and-drop interface
Zoho Analytics
Create interactive dashboards, charts, and reports that are easy to interpret and share.SAP Business Intelligence – Great SAP platform
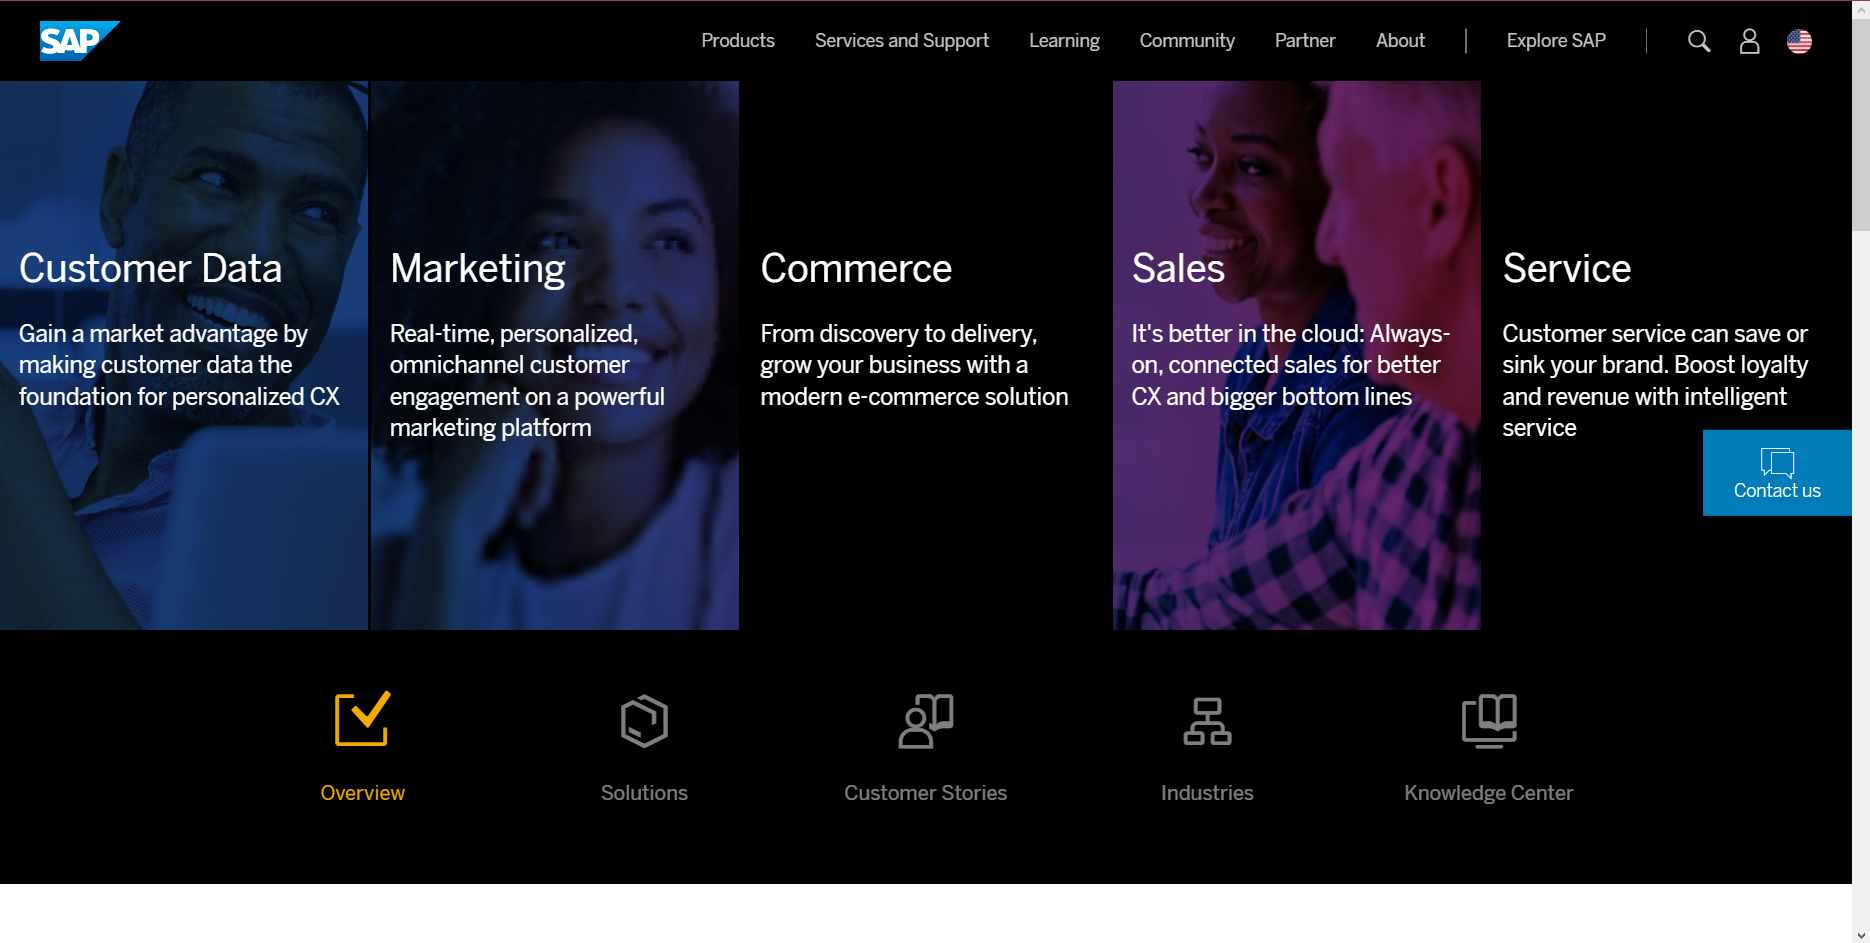
SAP Business Intelligence allows you to make better, more informed decisions with access to real-time insights on a single, scalable platform.
This centralized SAP report suite can be used for data reporting, visualization, and sharing.
SAP Business Intelligence transforms data into useful insights, which are available anytime and anywhere.
The platform offers on-premise deployment, real-time business intelligence, increased user autonomy, and simplified dynamic information consumption.
Take a look at its best features:
- Real-time, personalized, omnichannel customer engagement
- Cloud-based accessible dashboards
- Send notifications to the OpenDocument users
- Self-service visualization tools
- Role-based BI dashboards
DataPine – Great interactive dashboards
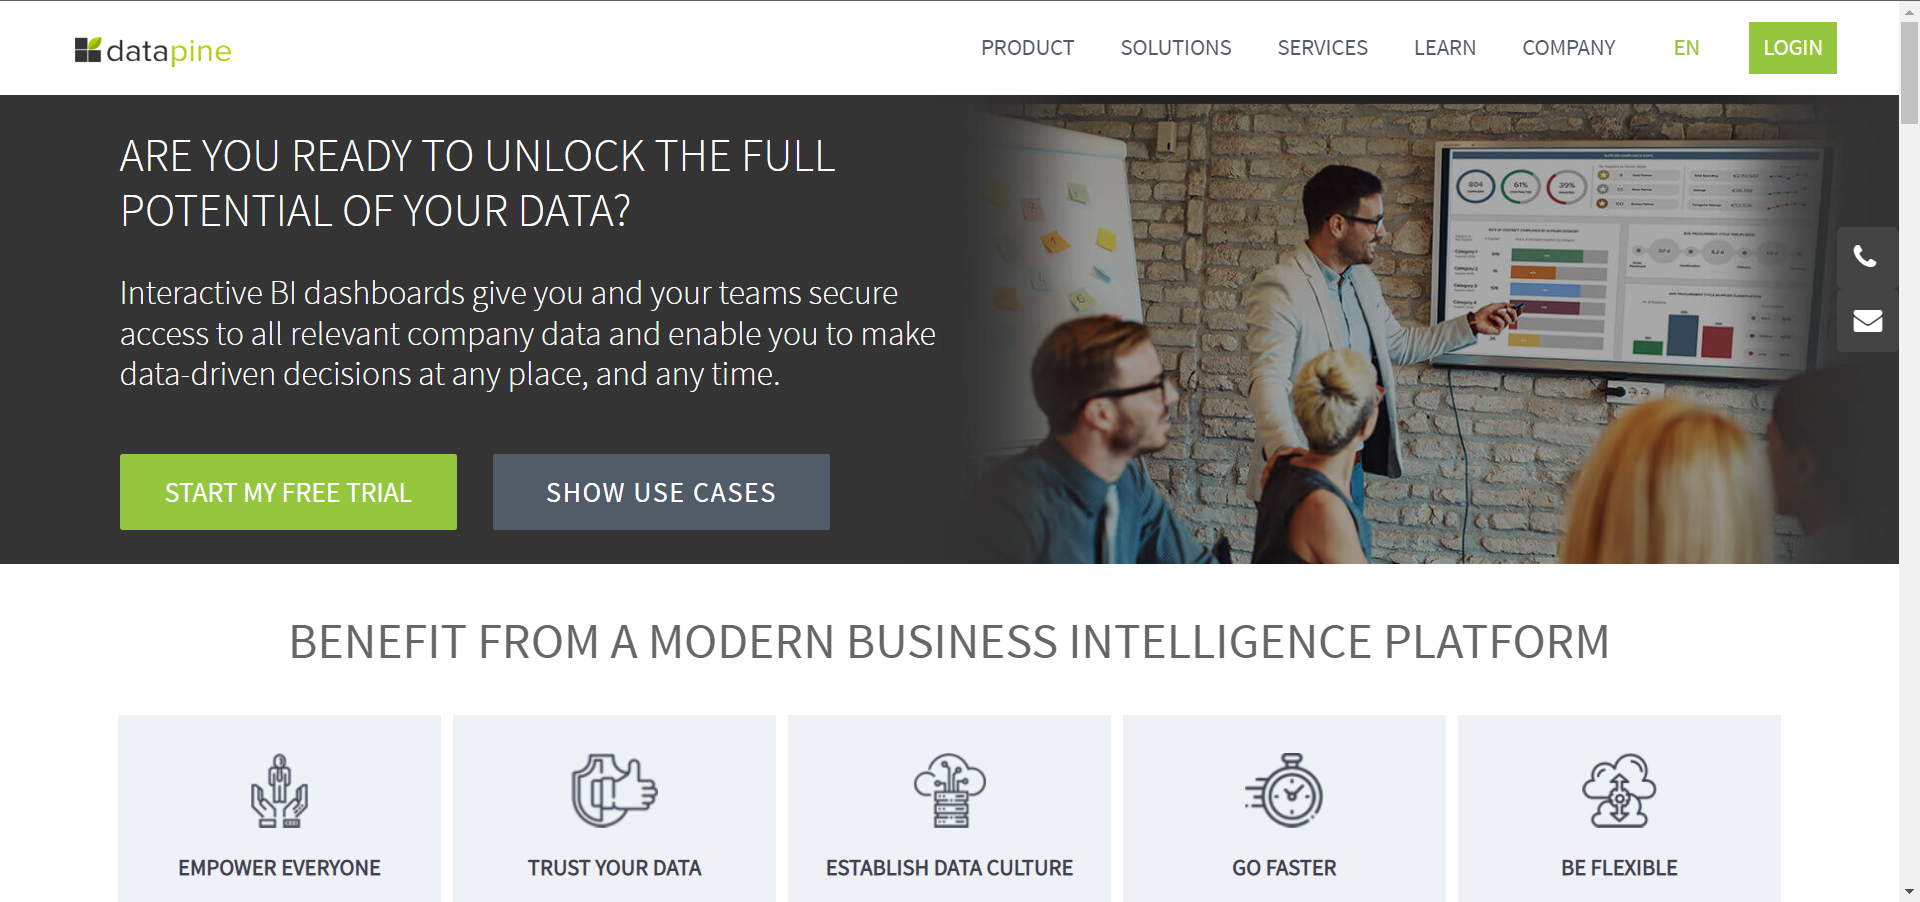
If you are looking for an all-in-one Business Intelligence platform, DataPine is a great option. Using this sap report tool, even non-technical users can process complex data analytics with ease.
DataPine helps you merge different data sets on the go without the need of restructuring your database.
You can explore data sets, visualize trends and patterns and build a professional dashboard to dig deeper into your data using an intuitive user interface.
It also offers different dashboards for every use case. The users can choose dashboards by function, industry, or platform.
Here are some of its most notable features:
- Create dashboards by function, industry, or platform
- Fast & easy data connectors
- Multiple, effective reporting options
- Intelligent, AI-based data alerts
- Modern predictive analytics tools
MicroStrategy – Perfect for SMBs
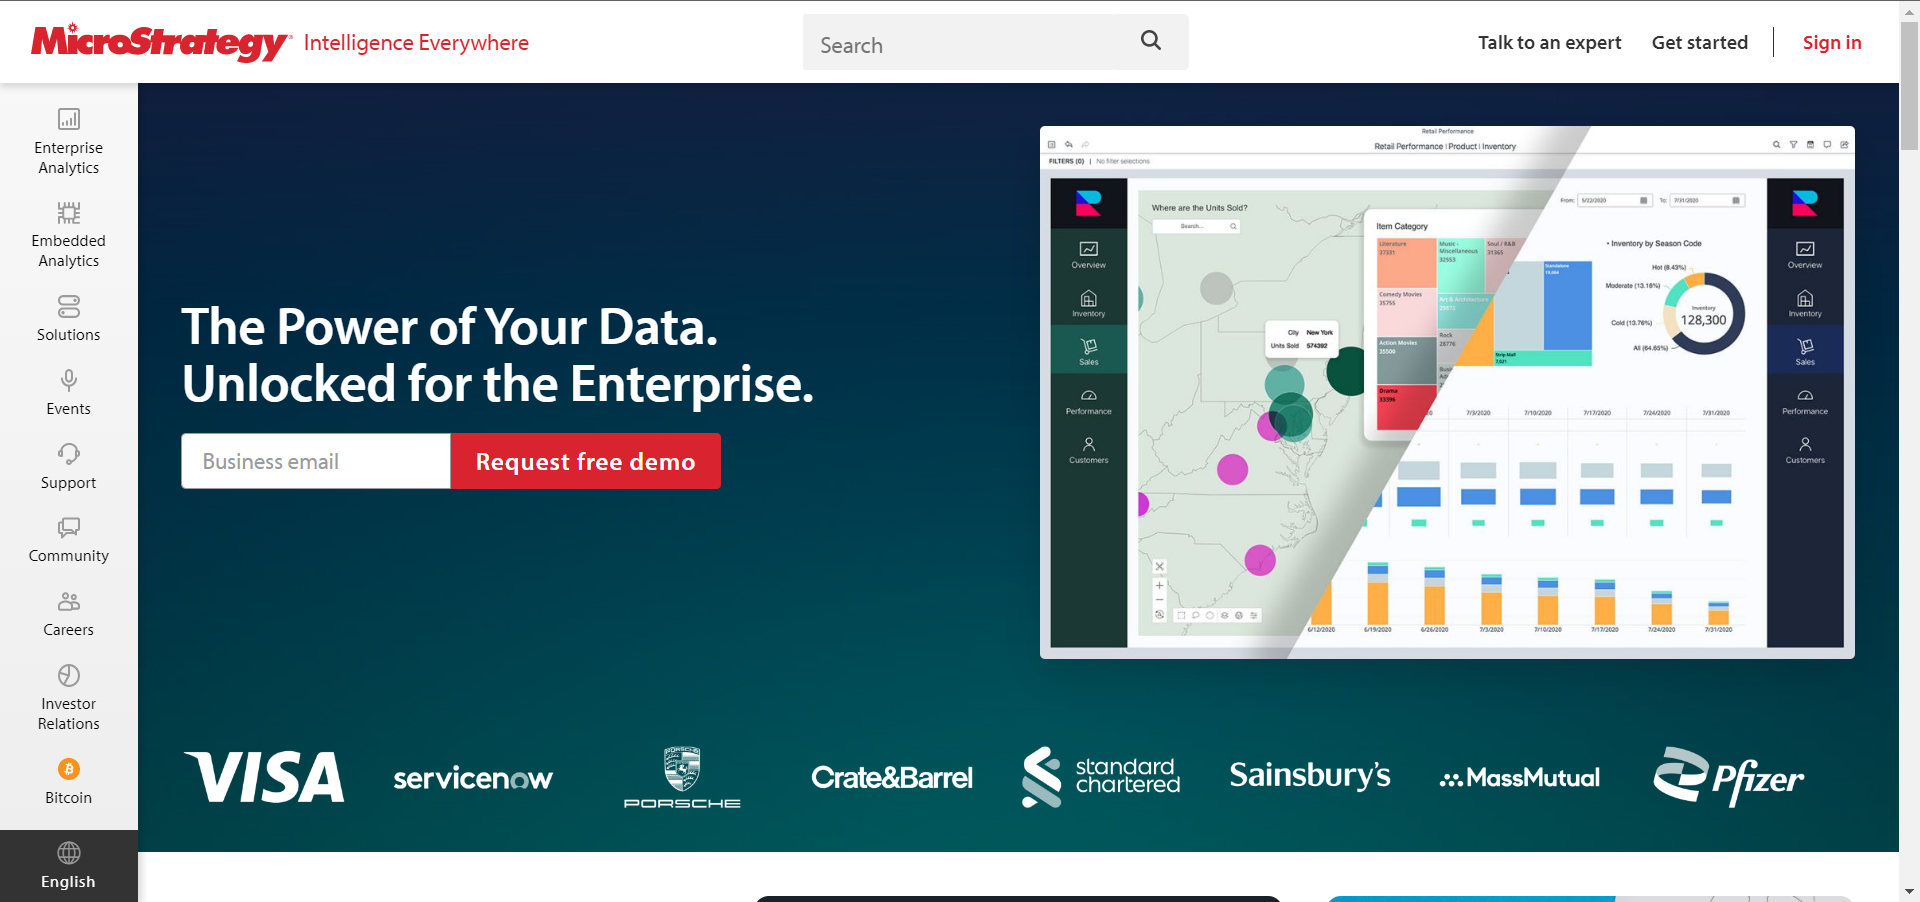
MicroStrategy is an intuitive Business Intelligence tool to analyze category performance. It offers powerful and high-speed dashboards and data analytics to help you monitor trends and improve productivity.
Irrespective of where the data is coming from spreadsheets, cloud services, or data software, MicroStrategy can help users connect with multiple sources with ease.
On the flip side, MicroStrategy is not the most efficient when the volume of data sets increases to thousands of rows and occasionally results in a timeout error.
MicroStrategy is an excellent tool for SMBs where the data is smaller in volume.
Here are some of its key features:
- Build consumer-grade intelligence applications
- View analytics content responds dynamically across any device, optimizing data analysis for users on web, desktop, or mobile
- Enhance collaboration with live messaging features that connect departments and increase engagement
- Deploy applications to thousands of users with automatic localization and security-by-design to protect your data
Yellowfin BI – Flexible solution
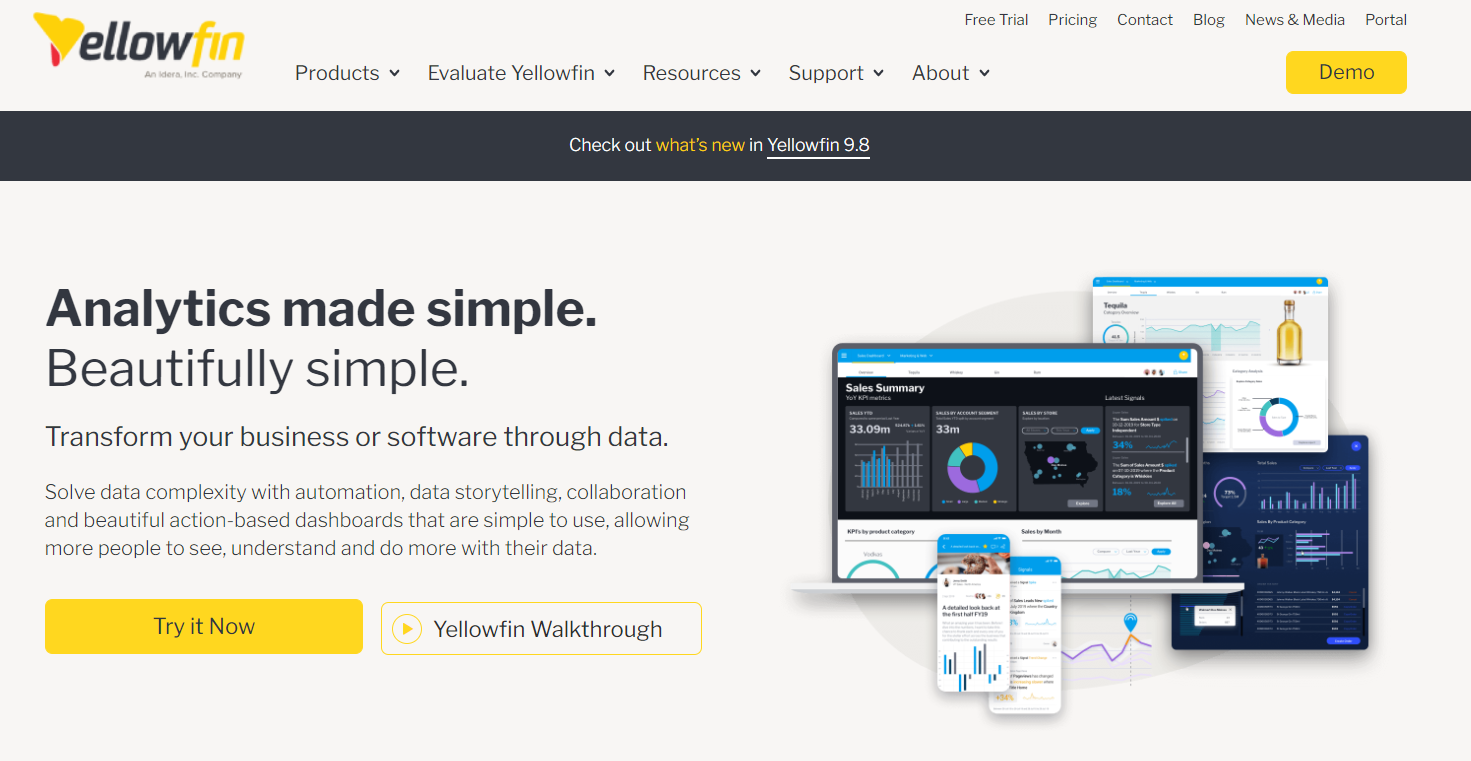
Yellowfin BI helps you transform your business through data-building beautiful dashboards to drive action and monitor your business in real-time automatically.
Yellowfin BI is one of the few analytics suites that combines action-based dashboards with industry-leading automated analysis and data storytelling.
You can easily filter through large volumes of data using the built-in filter. The tool’s flexibility means you can open the dashboards from anywhere through mobile and webpage.
Yellowfin BI is an end-to-end analytics platform that combines visualization, and collaboration to help you get more value from your data in new ways.
Take a look at some of its best features:
- Action based dashboards
- Automated Business Monitoring
- Comprehensive data stories & management reports
- Intuitive self-service BI options
SAP & Business Intelligence tools are an excellent mode of collecting useful information regarding your business, performance, and health.
It can also be used for converting raw data into knowledge as these tools allow you to extra and present data in charts, tables, and other visualization formats.
All the SAP & BI reporting tools listed in this article are handpicked among the top reporting applications, highlight their features, and belong to different price categories.
You might also be interested in our selection of the best automated CRM software for your business.
What do you think of these SAP & BI reporting tools? Do let us know in the comments.
Read our disclosure page to find out how can you help Windows Report sustain the editorial team. Read more


Improve this guide


User forum
0 messages