Technology Addiction: Real World Stats & Facts for 2025
Bytes & boundaries: A dive into digital reality
11 min. read
Updated on
Read our disclosure page to find out how can you help Windows Report sustain the editorial team. Read more
Key notes
- Teenagers who spend 5 hours daily on their smartphones are twice as likely to display signs of depression compared to those who spend less time.
- To learn more such facts and stats, keep reading!
Technology is intertwined in every facet of our daily lives. Therefore, it is important to understand the criticality and consequences of technology addiction.
In this comprehensive guide, we will discuss some technology addiction facts and statistics and the harmful effects on people to empower you to foster a balanced relationship with technology.
What are the effects of technology addiction?
- Sedentary lifestyle, eye strain, vision problems & sleep disruptions.
- Mental health issues, like stress, anxiety, depression, attention & concentration issues.
- Social isolation & relationship strain.
- Decreased productivity, reduced critical thinking, loss of control, and procrastination habits.
- Overspending on online purchases or subscriptions.
Statistics and Facts about Technology Addiction
In a survey report published by Ani Petrosyan on Nov 10, 2022, 48% of internet users in the United States considered themselves addicted to one or the other digital devices.
In the U.K., an average person spends more time using an electronic device than sleeping, which is 8 hours 41 mins, as per the Adults’ Media Use and Attitudes Report 2023 by Ofcom.
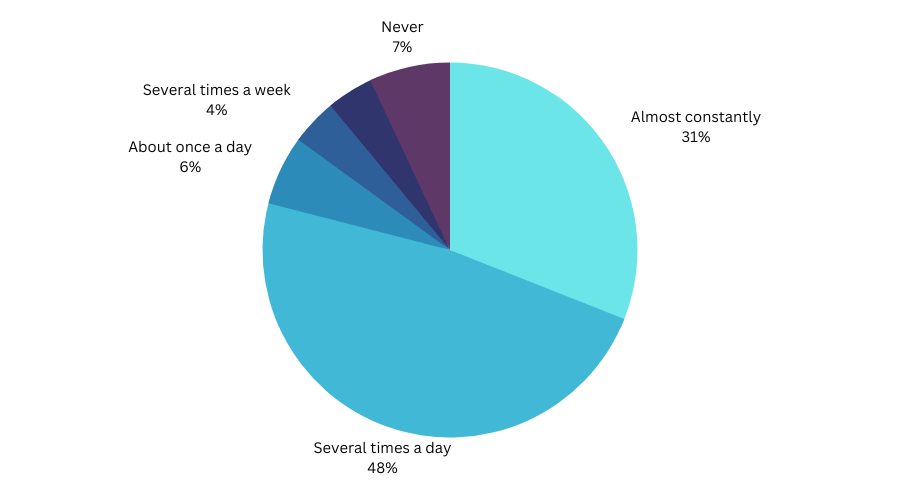
85% of Americans go online daily, 31% are always in cyberspace, 48% check their phones several times a day, and 6% are online once a day.
33.33% of technology users find taking a break from it challenging.
A DataReportal report in 2023 says that from total world population, 5.19 billion people are internet users, i.e., approximately 64.5% of the world’s population. Here are the details.
| Quarter | Number of Internet users (in millions) | Increase in % |
| July 2021 | 4959 | 0.1 |
| Oct 2021 | 4966 | 1.5 |
| Jan 2022 | 5041 | 0.1 |
| Apr 2022 | 5048 | 0.1 |
| July 2022 | 5087 | 0.8 |
| Oct 2022 | 5094 | 0.2 |
| Jan 2023 | 5132 | 0.7 |
| Apr 2023 | 5183 | 1.0 |
| July 2023 | 5192 | 0.2 |
The number of people worldwide still unconnected to the Internet has dropped to 2.85 billion, with the majority of people living in Africa, Southern & Eastern Asia.
468 million people have internet addiction which is 200 million more than drug users worldwide.
Smartphone impact on technology addiction- Latest statistics
95% of internet users worldwide use mobile phones to go online, accounting for 57% of our online time and 55 percent of web traffic.
If the total world internet users’ time using connected devices & services in 2023 is to be added, it equals 12.5 trillion hours of combined human existence.
The average daily usage of internet worldwide is 6 hours and 40 minutes, which 2.2% less than the daily average of last year.
A report by GWI says that an average person globally spends 2 hours and 26 minutes on social media every month.
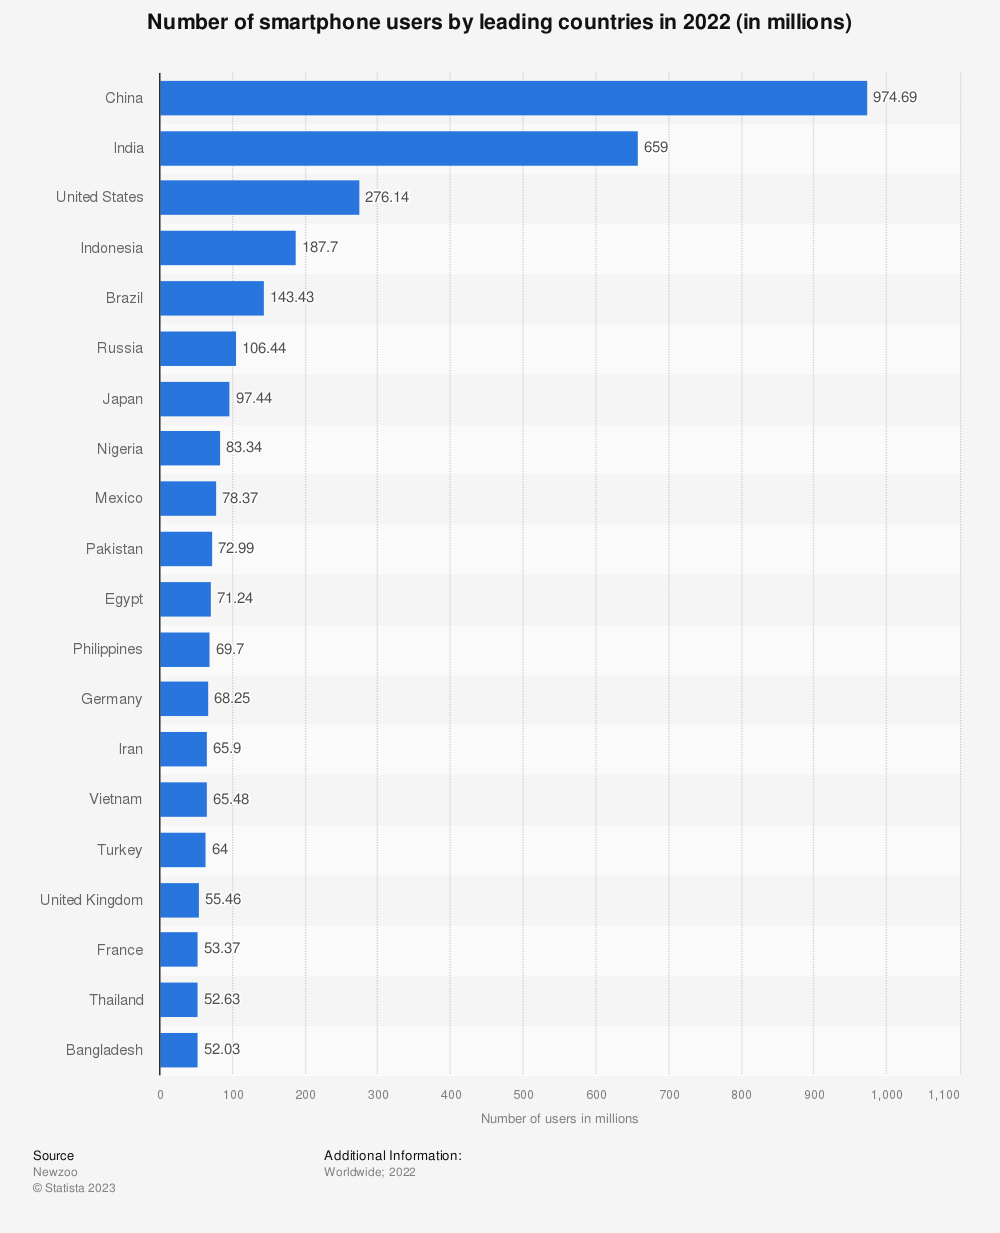
Regarding smartphone usage, the top five countries are China with 974.69 million, India with 659 million, the United States with 276.14 million, Brazil with 187.7 million & Russia with 106.44 million. Here are the other details:
A report in December 2022 by NDDC claimed that 25-30% of drivers distracted due to smartphones were in fatal car crashes, and there were 3142 deaths and 32,4652 injured in the United States.
According to a study by Asurion, Americans used to check their mobile devices 96 times a day in 2019; a follow-up study in 2022 revealed the number has increased to 352 times per day, i.e, once every 2 mins and 43 seconds a day if we exclude an average of 8 hours of sleeping time.
Gaming addiction statistics
There are 3.09 billion active video game users in the world. Here are the details with an estimated number of users for 2024 and the percentage of increase year on year:
| Year | Number of Gamers | Increase Over Previous Year | Increase Over Previous Year (%) |
| 2015 | 2.03 billion | – | – |
| 2016 | 2.17 billion | 140 million | ↑ 6.9% |
| 2017 | 2.33 billion | 160 million | ↑ 7.37% |
| 2018 | 2.49 billion | 160 million | ↑ 6.87% |
| 2019 | 2.64 billion | 150 million | ↑ 6.02% |
| 2020 | 2.81 billion | 170 million | ↑ 6.44% |
| 2021 | 2.96 billion | 150 million | ↑ 5.34% |
| 2022 | 3.09 billion | 130 million | ↑ 4.39% |
| 2023 | 3.22 billion | 130 million | ↑ 4.21% |
| 2024 | 3.32 billion | 100 million | ↑ 3.11% |
67% of adults and 76% of kids in the United States are video game players.
Theesa
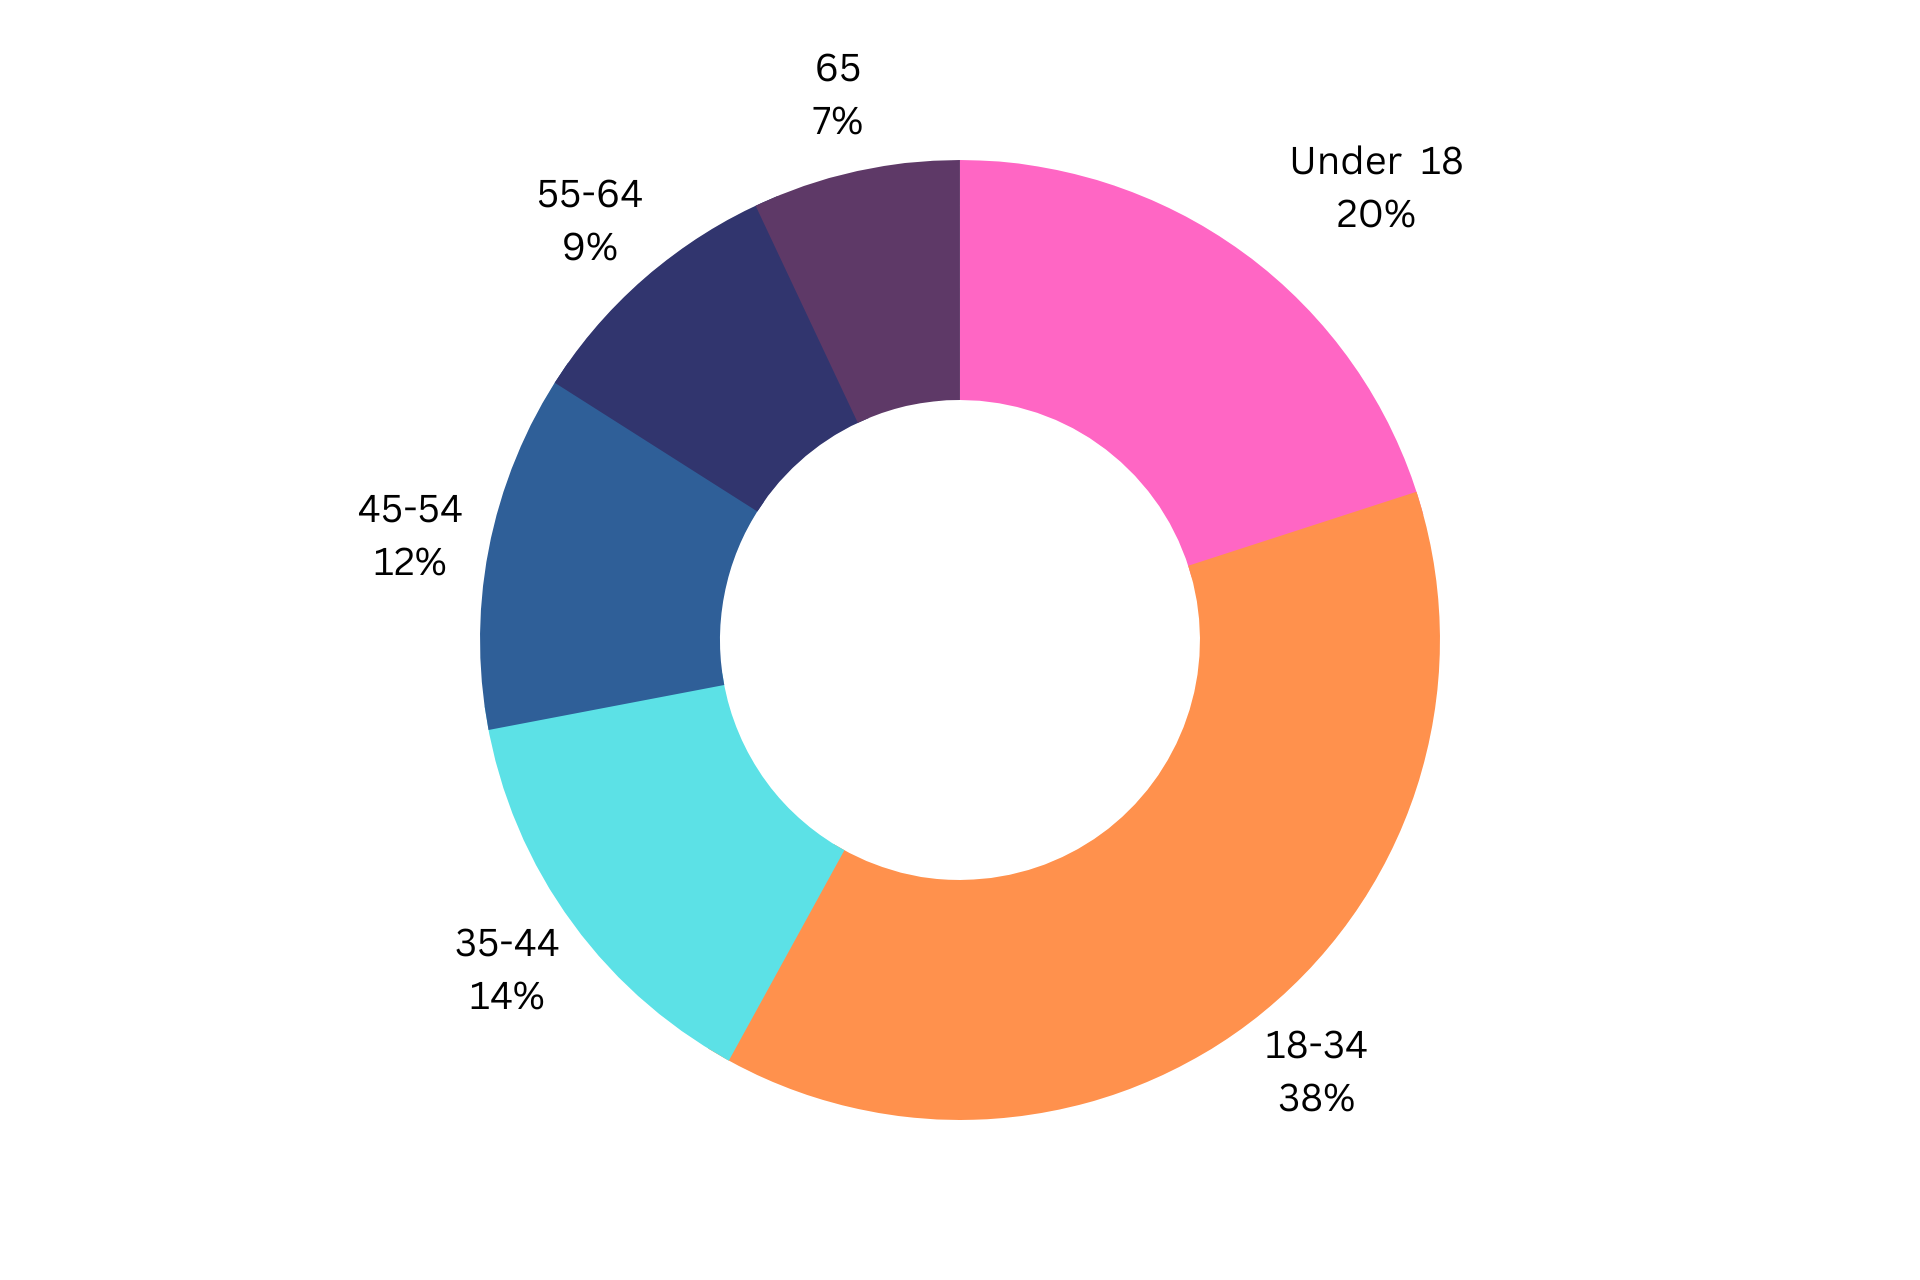
If we break down the players based on their age group, then the highest number of players, i.e, 38%, are from the 18-34 age bracket.
41% of boys spent time playing video games and only 11% of girls admit doing so.
Pew Research Centre
Social media boosts technology addiction- Latest statistics
According to a DataReportal survey, there are 4.76 billion social media users worldwide, 60% of the total population.
| Category | Users (in million) | Year-ON-Year Change |
| Total Population | 67 | 0.8% |
| Unique mobile phone users | 168 | 3.2% |
| Internet users | 98 | 1.9% |
| Active social media users | 137 | 3.0% |
The total percentage of males using the Internet is 67.2%, and 61.6% of females of the entire female population are recorded as internet users.
The average person spends 2 -3 hours a day on social media.
According to DataReportal, January 2023, TikTok is the most addictive social media app globally, with 23.5 hours spent per month, followed closely by YouTube, with 23.1 hours per month. Here are the details for other apps:
| Social media app | Time spent in hours/month |
| TikTok | 23.5 |
| YouTube | 23.1 |
| 19.7 | |
| WhatsApp Messenger | 17.3 |
| 12.0 | |
| Line | 11.0 |
| 5.5 | |
| Telegram | 4.0 |
| Snapchat | 3.2 |
| Facebook Messenger | 3.1 |
However, to be considered addicted to social media, a person has to spend 21.5 hours per week on it.
In the United States, nearly 14 million teens could be suffering from mild social media addiction.
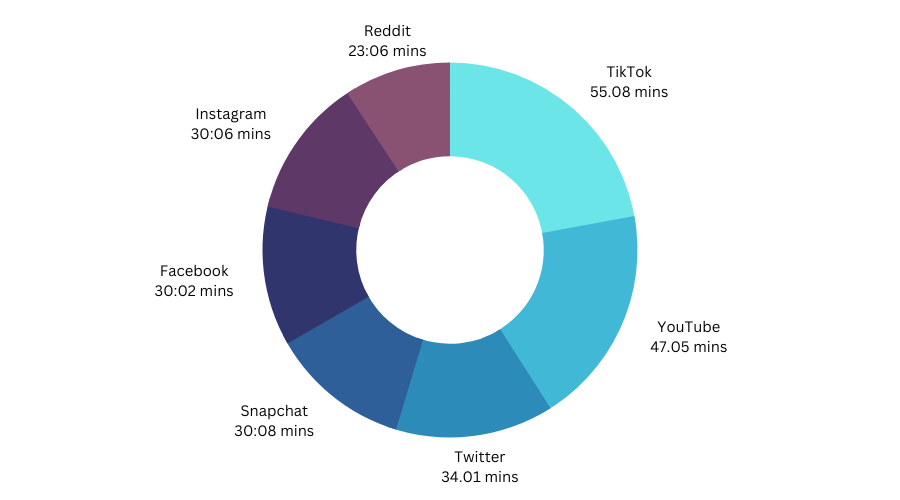
In the United States, an average user spent 55.8 minutes on TikTok in 2022, making it the most-used app in the region. Here are the details for all popularly used apps:
The highest social media usage was recorded in the Philippines at 4 hours and 12 mins, followed by Brazil at 3 hours and 39 mins, Columbia at 3 hours and 34 mins, and Nigeria at 3 hours and 26 mins.
Approximately 40% of the total adult social media users exhibit slight symptoms of depression, and 8.8% show severe signs.
54% of teens says it is challenging to give up social media.
Pew Research Centre
Social media, mobile phones, and video games are critical contributors to internet addiction, but there are more; read this guide to detailed screen time statistics.
Pervasive reach of technology addiction – Prevalence & statistics
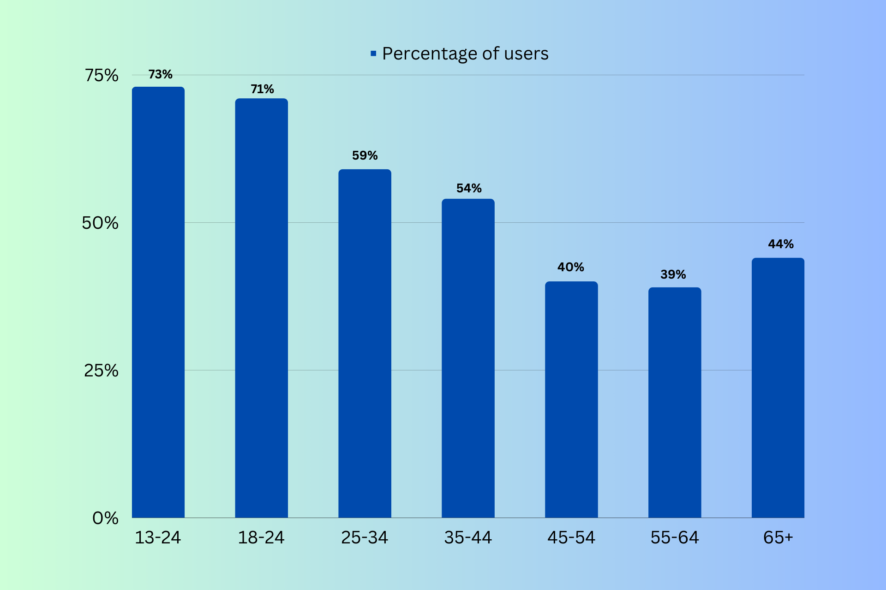
Technology addiction is prevalent in all age groups, with a significant focus on youth, as 73% of users fall within the 13 – 17 age bracket, closely followed by 71% in the 18-24 age group. Here are other details:
| Age groups of users with internet addiction | Percentage |
| 13-24 | 73% |
| 18-24 | 71% |
| 25-34 | 59% |
| 35-44 | 54% |
| 45-54 | 40% |
| 55-64 | 39% |
| 65+ | 44% |
A study by Common Sense Media says that American teenagers spend a staggering 9 hours a day streaming video, playing games, and listening to music.
The tweens (8-12 years) spend 6 hours with digital devices in 2021 apart from the schoolwork.
1 out of every 2 teens are addicted to their devices, and 59% of parents feel that their children are addicted.
Common Sense Media
32% of teens and 36% of parents admit to arguing about the device usage every day.
Increasing purchase of computers & other electronic devices and the rising dependency on them indicate that it’s high time to address the growing concern of addiction and its adverse effects on people.
Mapping Technology Addiction: Global impact statistics
The average screen time by country statistics shows South Africa leading with 9 hours and 38 minutes, and Japan still maintains its position at 3 hours and 45 minutes, whereas the United States at 6 hours and 59 minutes.
This somewhat indicates technology addiction worldwide. Here is the latest data for all countries compared with the last year:
| Country | Time spent (HH: MMH.H.(2022) | Time spent (HH: MMH.H.2023) |
| South Africa | 10:46 | 09:38 |
| Brazil | 10:19 | 09:32 |
| Philippines | 10:27 | 09:14 |
| Argentina | 09:38 | 09:01 |
| Colombia | 10:03 | 09:01 |
| Mexico | 08:55 | 08:07 |
| Malaysia | 09:10 | 08:06 |
| Thailand | 09:06 | 08:06 |
| Russia | 07:50 | 07:57 |
| Indonesia | 08:36 | 07:42 |
| Egypt | 08:02 | 07:41 |
| Portugal | 07:56 | 07:37 |
| U.A.E. | 08:36 | 07:29 |
| Turkey | 08:00 | 07:24 |
| Saudi Arabia | 08:05 | 07:20 |
| Taiwan | 08:07 | 07:14 |
| Israel | 07:35 | 07:08 |
| Romania | 07:09 | 07:03 |
| U.S.A. | 07:05 | 06:59 |
| Singapore | 07:29 | 06:59 |
| Poland | 06:39 | 06:42 |
| Canada | 06:45 | 06:35 |
| Hong Kong | 06:46 | 06:26 |
| India | 07:19 | 06:23 |
| Vietnam | 06:38 | 06:23 |
| New Zealand | 06:23 | 06:12 |
| Sweden | 06:22 | 06:02 |
| Greece | 06:06 | 06:00 |
| Ireland | 06:30 | 05:59 |
| Italy | 06:09 | 05:55 |
| Australia | 06:13 | 05:51 |
| U.K. | 0U.K2 | 05:47 |
| Spain | 06.04 | 05:45 |
| Switzerland | 05:44 | 05:38 |
| Belgium | 05:45 | 05:27 |
| Netherlands | 05:11 | 05:27 |
| France | 05:34 | 05:26 |
| China | 05:12 | 05:25 |
| Austria | 05:42 | 05:22 |
| South Korea | 05:29 | 05:21 |
| Germany | 05:22 | 05:12 |
| Denmark | 05:02 | 04:58 |
| Japan | 04:26 | 03:45 |
The average time spent has decreased for most countries except China (5:25) and the Netherlands (05:27).
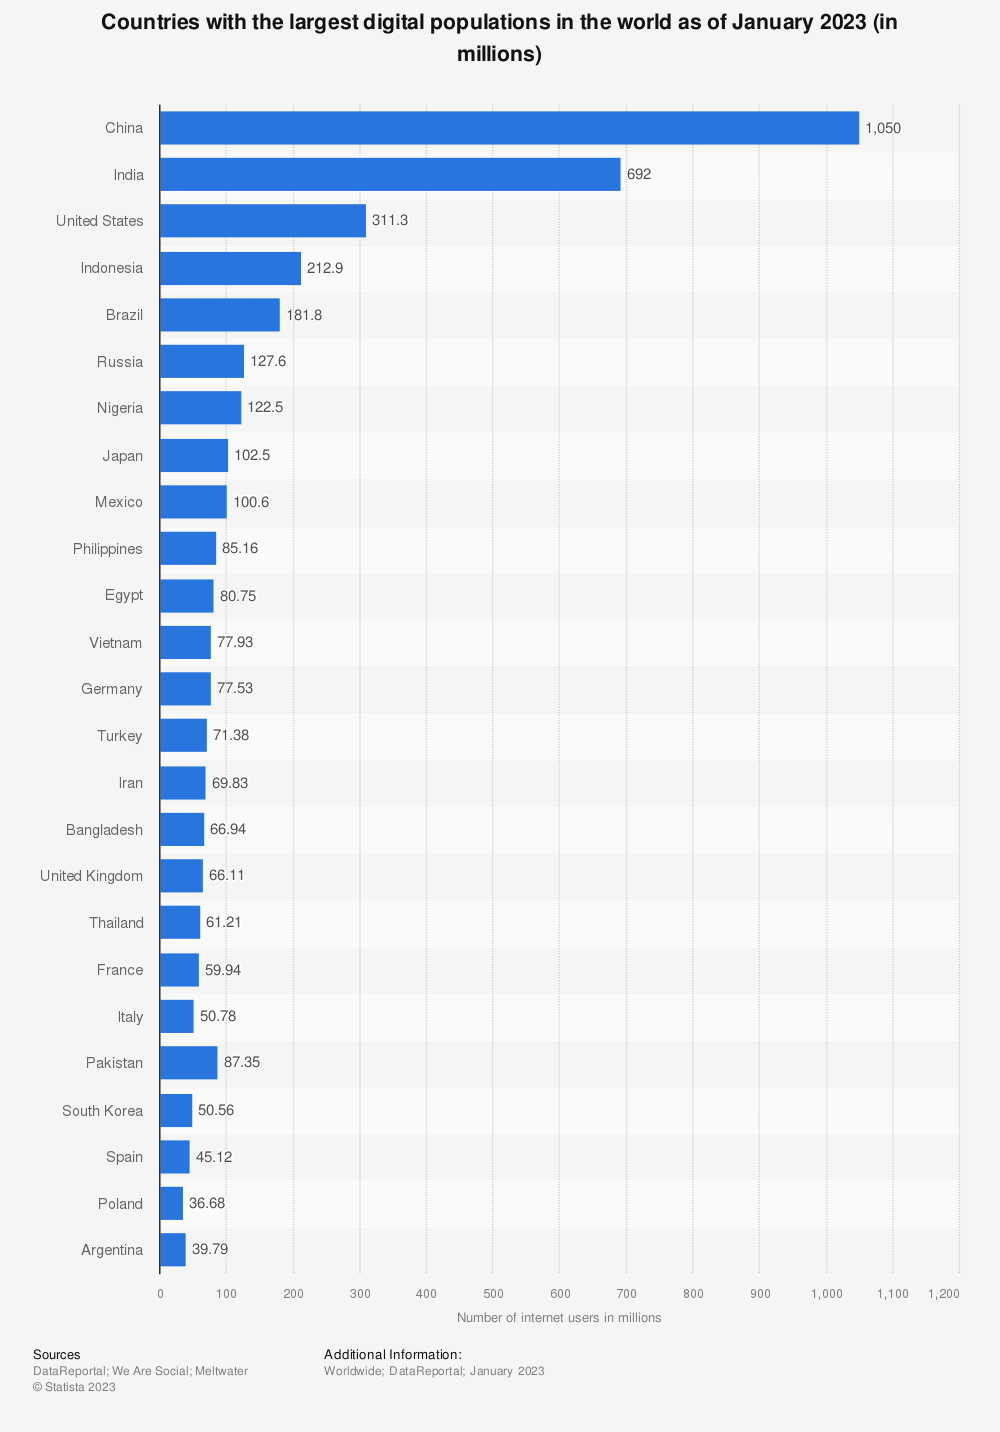
However, if we talk about the highest number of Internet users, China is leading with 1050 million people, followed by India, with 692 million, and the United States, with 311.3 million.
Causes of Technology Addiction
Various social factors play a significant role in technology addiction; some of the common ones are:
- Peer influence – If friends and peers are heavily engaged with technology, it can drive people to mimic their behavior, increasing usage and leading to addiction.
- FOMO – The fear of missing out on events, updates, & trending topics on social media and the need to stay updated can cause compulsive checking, leading to excessive use of tech.
- Validation and self-esteem – The approval garnered from social media engagements and online interactions is addictive, making a person believe that more attention equates to higher self-worth.
- Cyberbullying and social pressure – Bad experiences like cyberbullying or social pressure to maintain an image could increase an individual’s screen time and constantly take refuge in technology.
- Parental influence and role modeling – Parents’ tech habits & attitudes can impact a kid’s relationship with technology.
These are not the only reasons; there are psychological factors that lead to the addiction; some of them are:
- Stress relief and escape route – For some people, technology is a stressbuster, and they use it as a coping mechanism for their problems, which leads to dependency.
- Instant gratification – With social media likes or reactions, people get instant gratification, which can be addictive, and people can become habitual & use it frequently to get quick rewards.
- Fear of boredom – Being alone with one’s thoughts may sound divine for some, but it could be scary for others. Therefore, they use technology to combat discomfort and loneliness.
- Loss of control – Despite the desire to reduce technology usage, people can have anxiety due to losing control over it.
- Emotional regulation– People turn to technology to get a sense of relief, comfort, and companionship. They immerse themselves in virtual interactions and online activities to eliminate loneliness.
Signs & Symptoms of Technology Addiction
- Spending more time online than intended and neglecting other activities indicates a lack of control or management over tech usage.
- Constantly thinking about being online or checking your device, and often feel anxious or restless when unable to do so.
- Experiencing irritability, mood swings, and signs of depression & anxiety if unable to spend time online or utilize technology.
- Neglecting social face-to-face interactions, failing to fulfill your responsibilities towards work, school, or home, and avoiding social gatherings due to excessive time spent on tech.
- Hiding the time spent online or using technology from your friends and family, downplaying the severity of the problem.
Treatment for Technology Addiction in 2023
- In Digital detox, individuals can design a plan to reduce technology use and utilize the time to reconnect with friends & family or learn something new.
- Adopt healthy lifestyle choices, including a balanced diet, regular exercise, adequate sleep, and engagement in offline social activities.
- Join in-person support groups to relate to other people’s challenges and share your experiences, providing mutual encouragement.
- Cognitive Behavioral Therapy (CBT), also known as talk therapy, focuses on coping skills to manage triggers & cravings, helping identify and change negative thought patterns related to technology use.
- Mindfulness-Based Cognitive Therapy (MBCT) combines mindfulness techniques with cognitive-behavioral strategies, helping individuals become aware of their technology usage and manage the constant urge to use it.
- Motivational Enhancement Therapy (MET) uses assessment, feedback, and goal-setting to boost positive changes related to the problematic behaviors associated with tech use.
What percentage of people overuse technology?
Roughly around 6.09% of our global population struggles with internet addiction. It is alarming and can inflict severe damage on physical & mental health, reduce productivity, & strain relationships, diminishing the quality of life.
How does technology affect mental health?
The constant need to check your mobile phone for notifications and updates can overwhelm & burn out an individual.
Also, excessive use could lead to sleep disorders, anxiety, decreased self-esteem, body image issues, and depression.
How does technology affect our critical thinking?
Excessive use of social media and smartphones can reduce your attention span and the ability to concentrate, leading to lower memory retention.
Technology, while providing access to vast amounts of information, often encourages superficial engagement.
This can result in a lack of depth in understanding, impeding the development of deep analytical thinking and discernment abilities.
The technology addiction statistics 2023 presented here underscores the prevalence and urgency of addressing this alarming issue in the fast-evolving digital age.
Implementing strategies for digital detox and embracing a balanced life with offline social connectivity can help you deal with the addiction.
If you often find yourselves reading about stats, we suggest you check out our exciting guide on desktop vs laptop market share.
How can one break free from the digital shackles of technology? Mention your thoughts in the comments section below and help others to detox.





User forum
0 messages