Fix: Chrome Failed To Load Response Data Request
Chrome DevTools is not without its errors

Encountering Chrome Failed To Load Response Data Request Content Was Evicted From Inspector Cache in DevTools can hinder web development tasks. This error often arises with large JSON files or cross-domain requests.
Here’s how to troubleshoot it in a few steps:
How can I fix the failed to load response data error in Chrome?
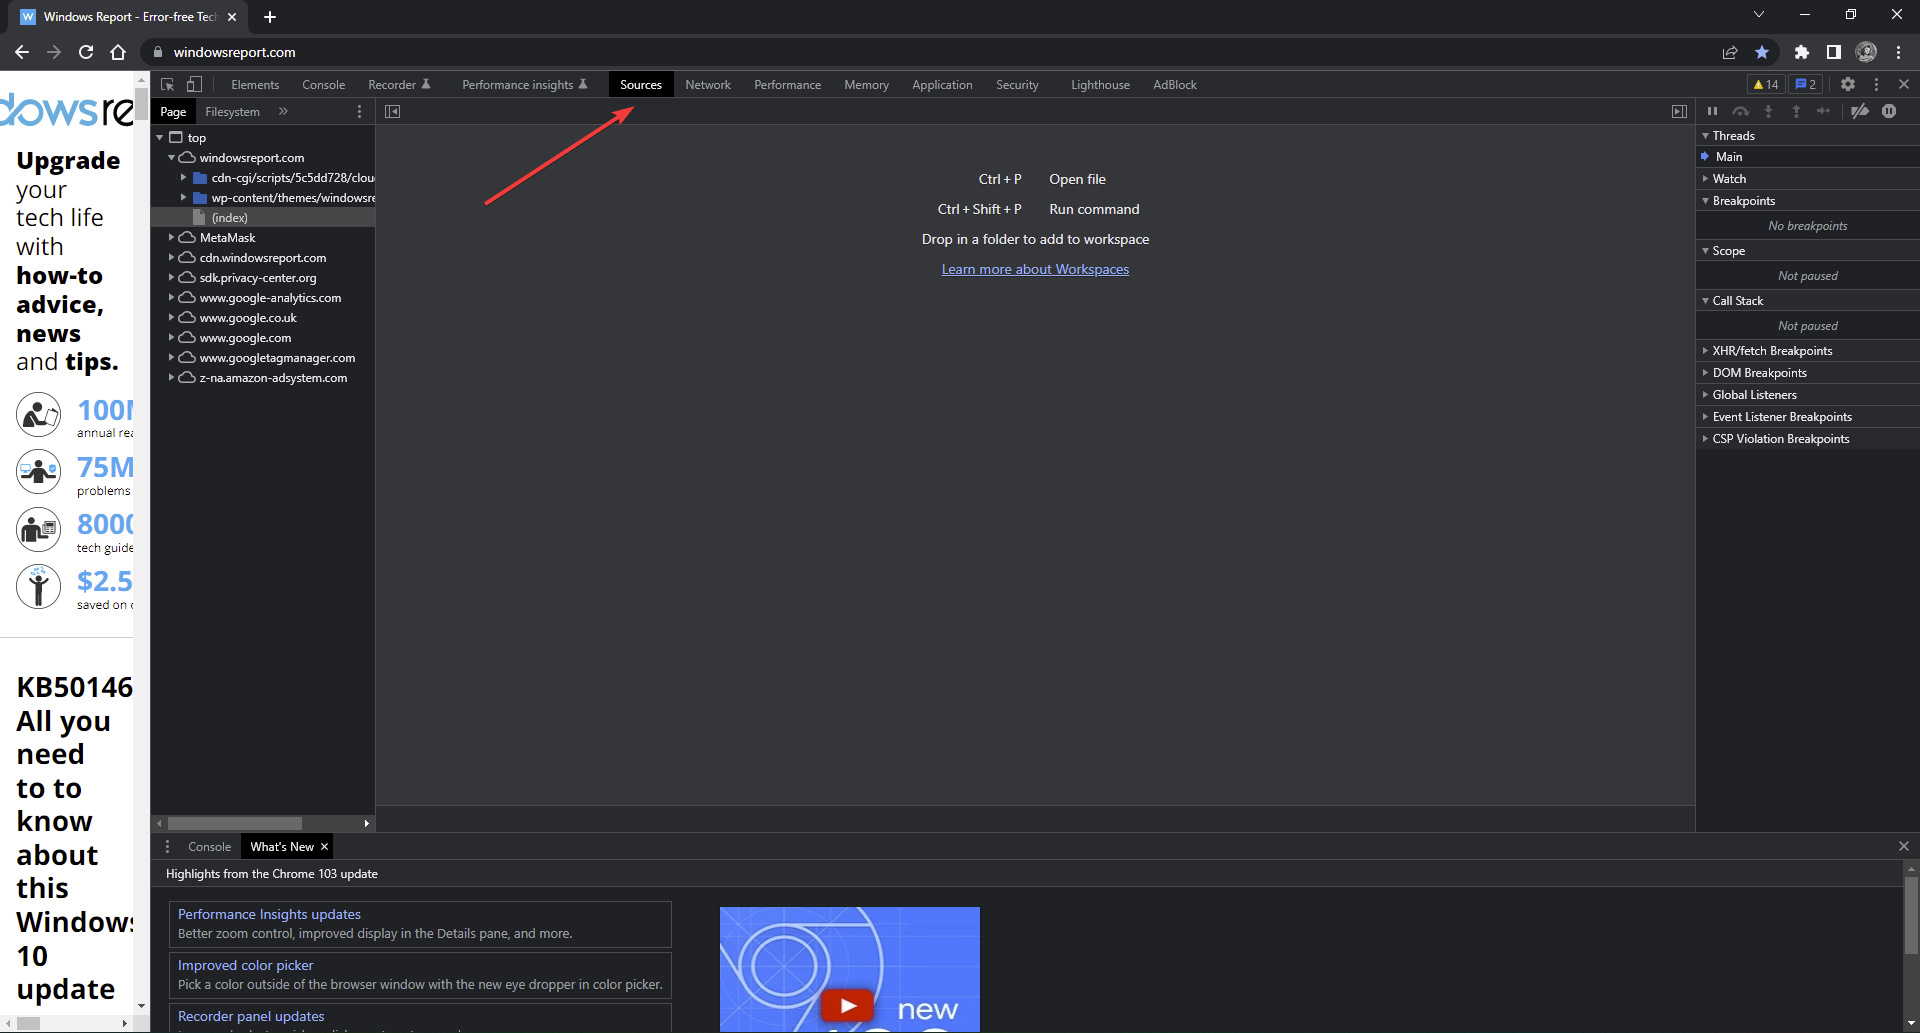
1. Add a breakpoint in the Sources tab
- In Chrome DevTools, click on the Sources tab.
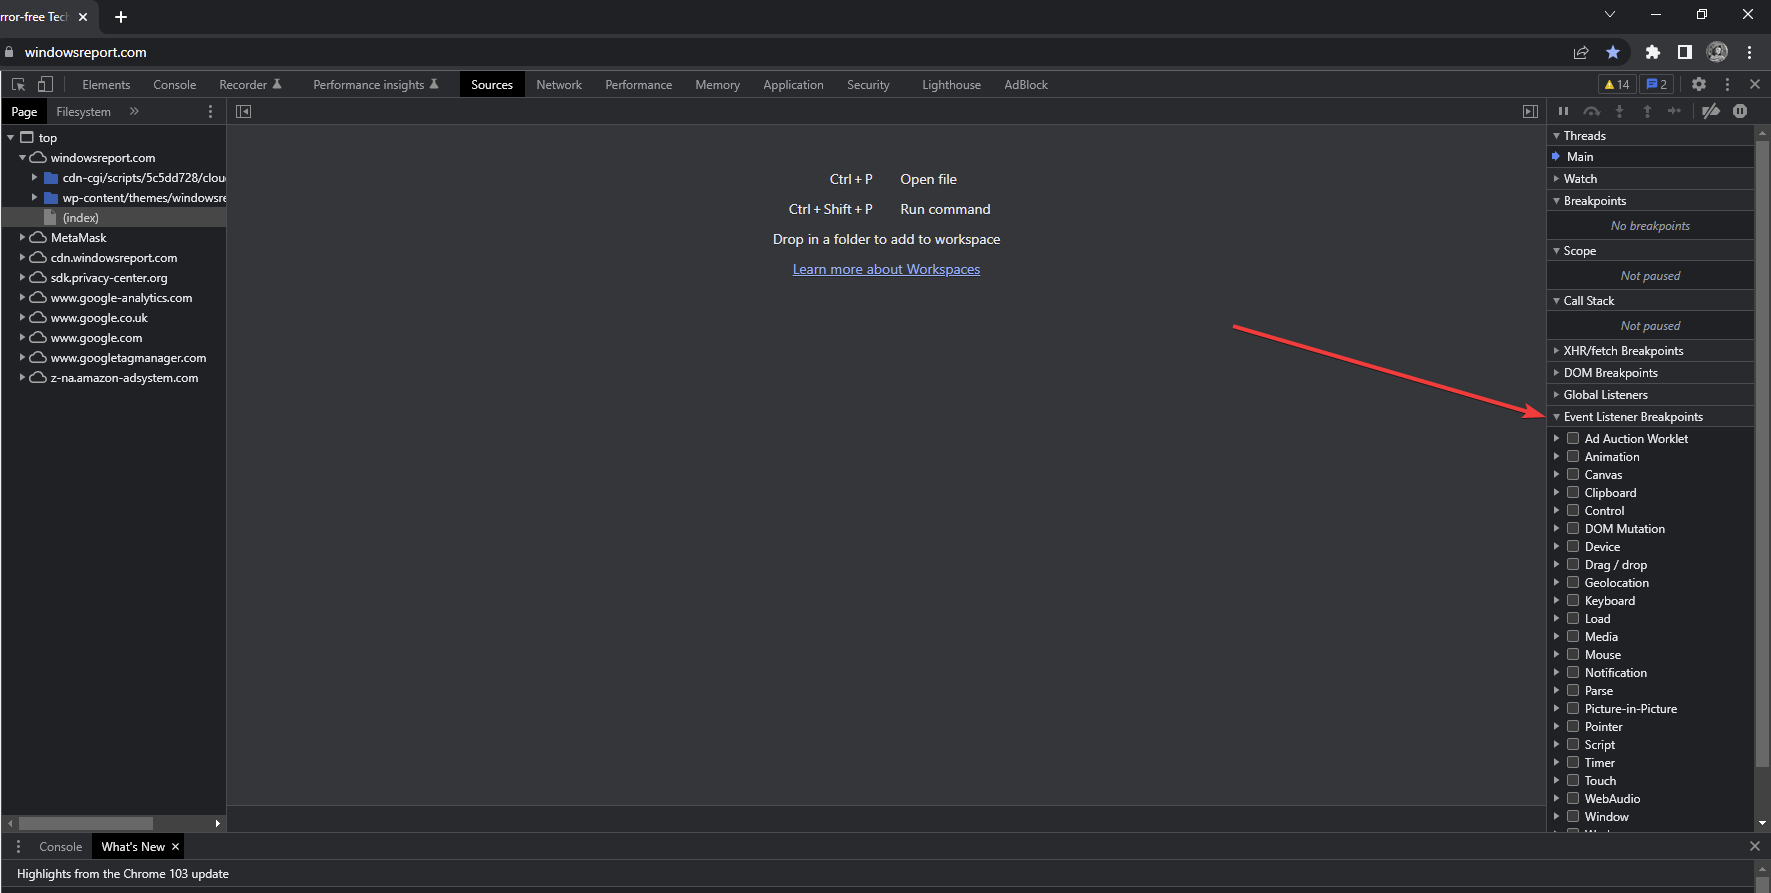
- Expand the Event Listener Breakpoints.
- Expand Load and then check the box next to beforeunload.
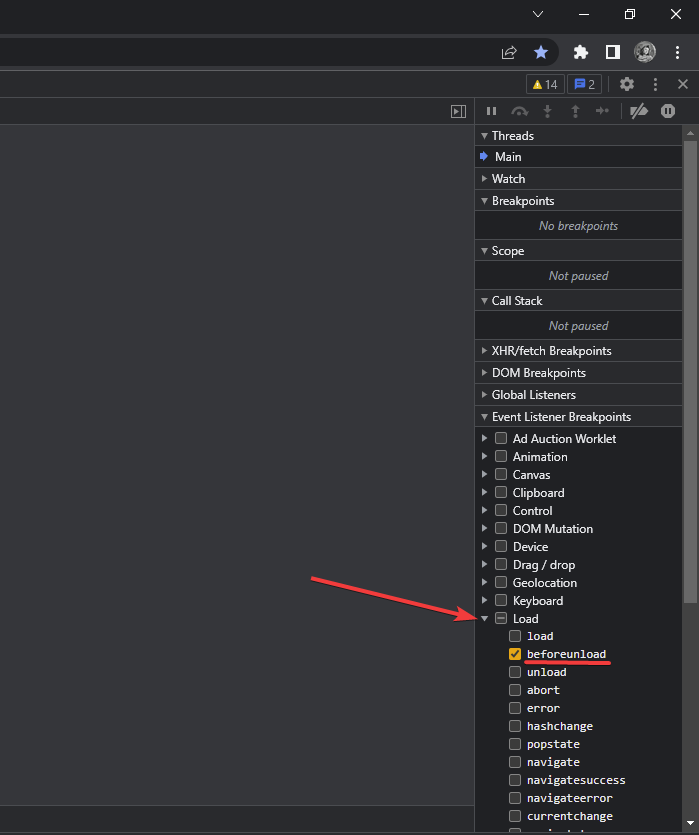
- Reload request.
Users report that performing this function is better than the window.onunload = function() {debugger; } command because there’s no need to write code.
2. Use Postman to view response
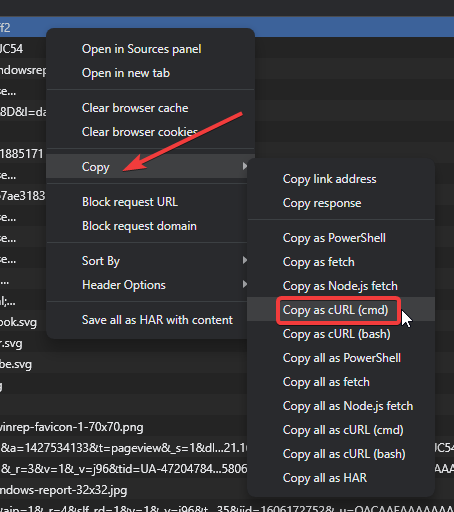
- In Chrome DevTools click on the Network tab.
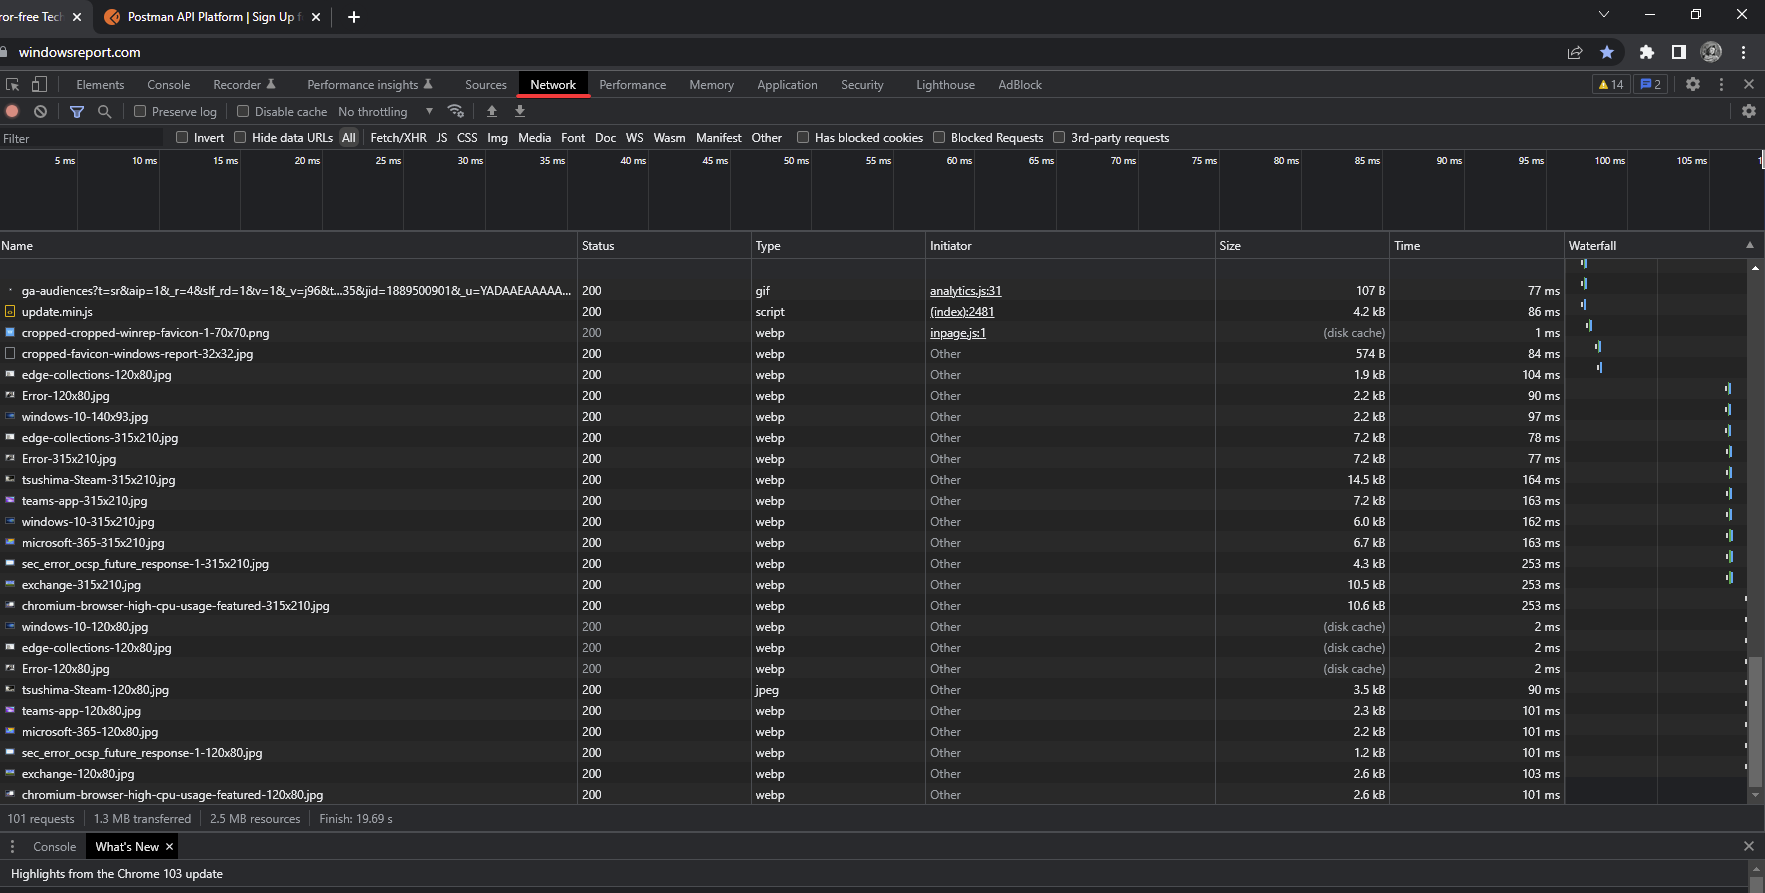
- Locate the request and right-click.
- Select Copy, then Copy as cURL.
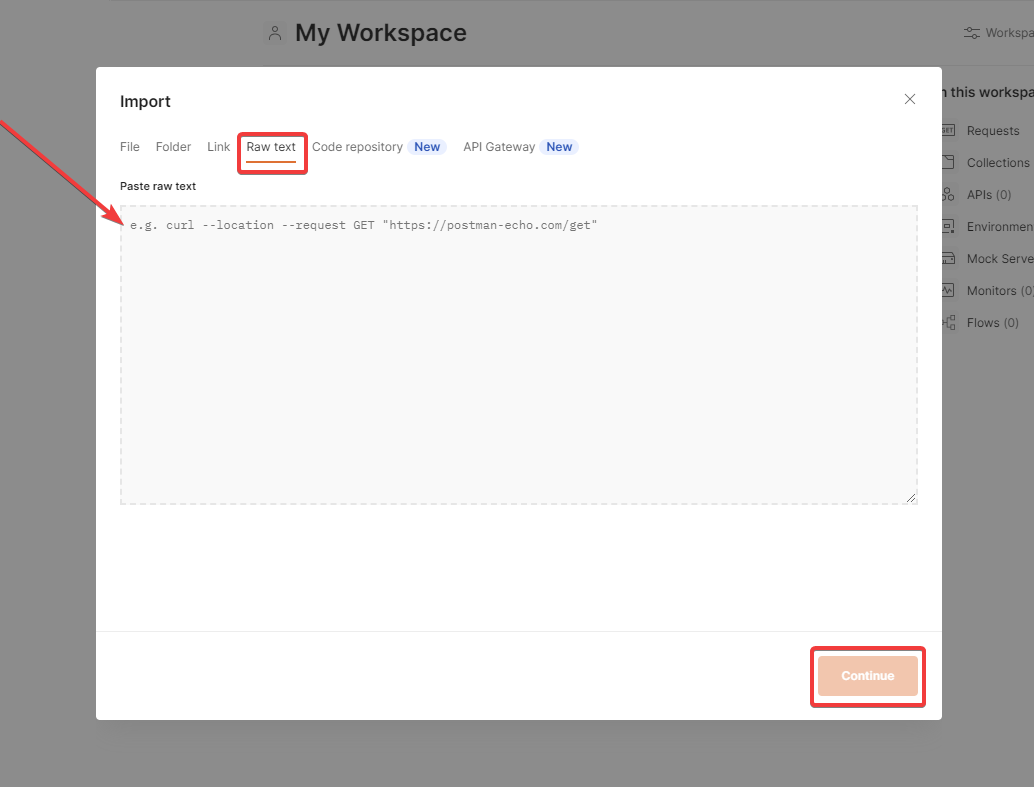
- Open Postman and select Import.
- Under Raw text, past the cURL and click Continue.
If you’re having issues with the Postman extension for Chrome not working, we have solutions for that as well.
We have to mention that this problem is somewhat similar to GraphQL unauthorized error that we covered recently, so don’t miss it.
3. Use a different browser
If you keep getting this error time and time again, consider switching to another browser with Dev Tools such as Opera GX.
It uses Chromium, the same engine as Chrome so compatibility standards should be no issue. Plus, the GX Control feature gives you precise control over system resources.
Plus, you can use all the same extensions you would use in Chrome and transfer all your history and bookmarks with minimal effort.

Opera One
Never worry about stability and keep your work organized with this feature-rich browser.This appears to be a long-running bug with Chrome DevTools, but we hope one of the above solutions helped solve the problem or at least allowed you to view the response data. Let us know in the comments if there is a solution that worked for you that isn’t listed above.
Read our disclosure page to find out how can you help Windows Report sustain the editorial team. Read more


Improve this guide

User forum
0 messages