How To Disable Filter On Visual In Power Bi [Step-By-Step]

Filtering data in Power BI is the main feature for people who want to visualize various sets of information. It is an interactive tool which usually doesn’t bring many issues.
However, there are some instances in which you don’t need a filter. Quite a few users reported issues with disabling a filter in Power BI and today we will show you what it needs to be done to solve them.
One user described the following issue on the official forum:
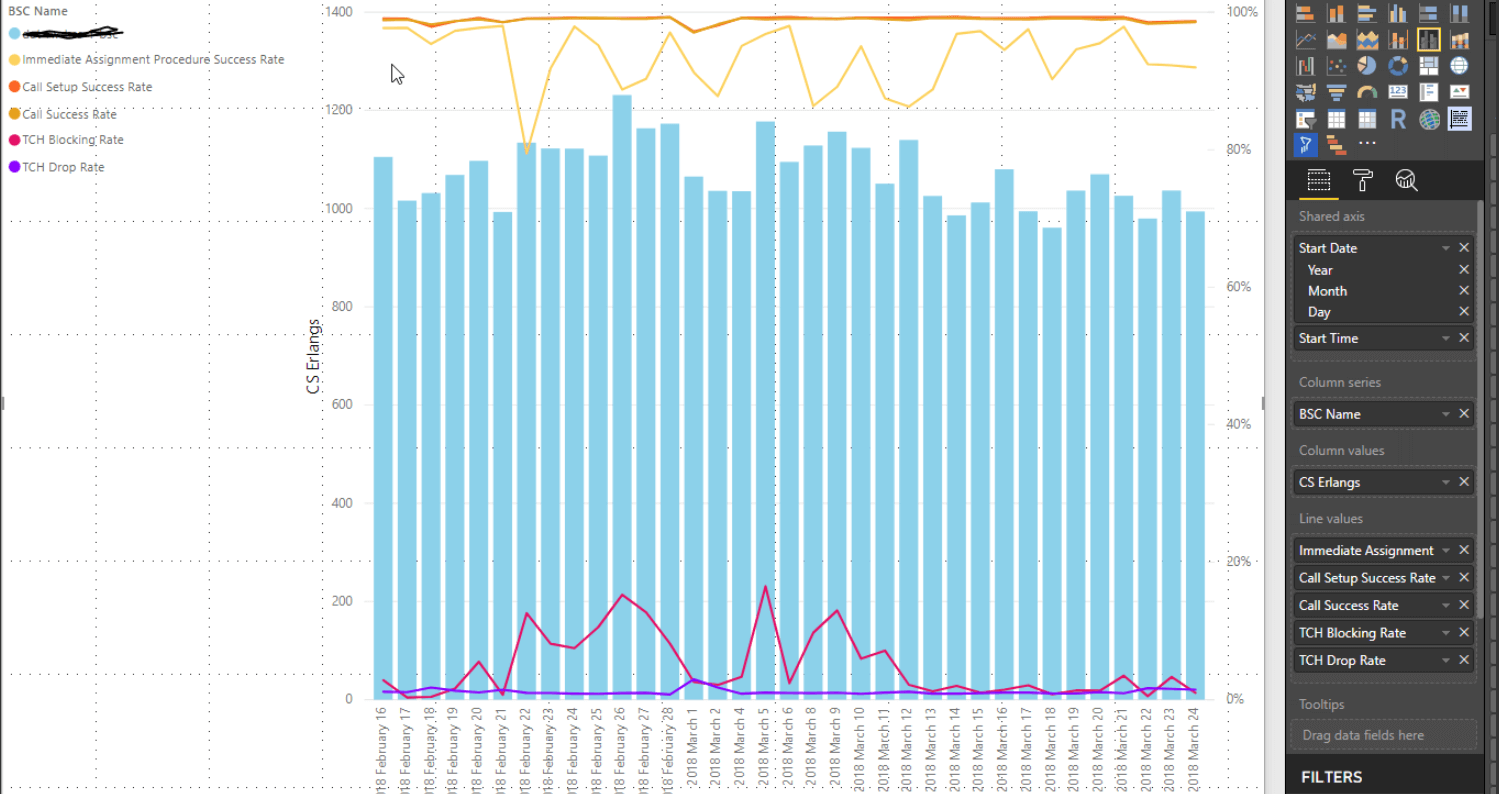
I have a problem with filtering. What I want to do to have a chart like below showing a trend of Sales and expense and have a dynamic timeline to adjust the dates on the chart. BUT I want to show an expense percentage of sales for 2015/2016 on a card unaffected by timeline visuals.
So, the automatic filtering on visuals poses a problem for the OP.
This is not the only issue encountered by users. Another one reported the following:
I have a multi-page report that I publish to the web each week for upper managment. I have received a request from them to have the ability to disable all of the lines values except one of them. Basically, they want the ability to toggle the line values in a graph on and off similar to the way you would toggle values in a slicer. Is this possible? For example, in the image below, they would like to toggle on/off any or all values in the legend. And, this must be done via the published WebUI. Is it possible?
The OP of this thread wants to disable all lines except one. It is worth mentioning that the operation must be done through the published WebUI.
How can I disable filter on visual on Power BI?
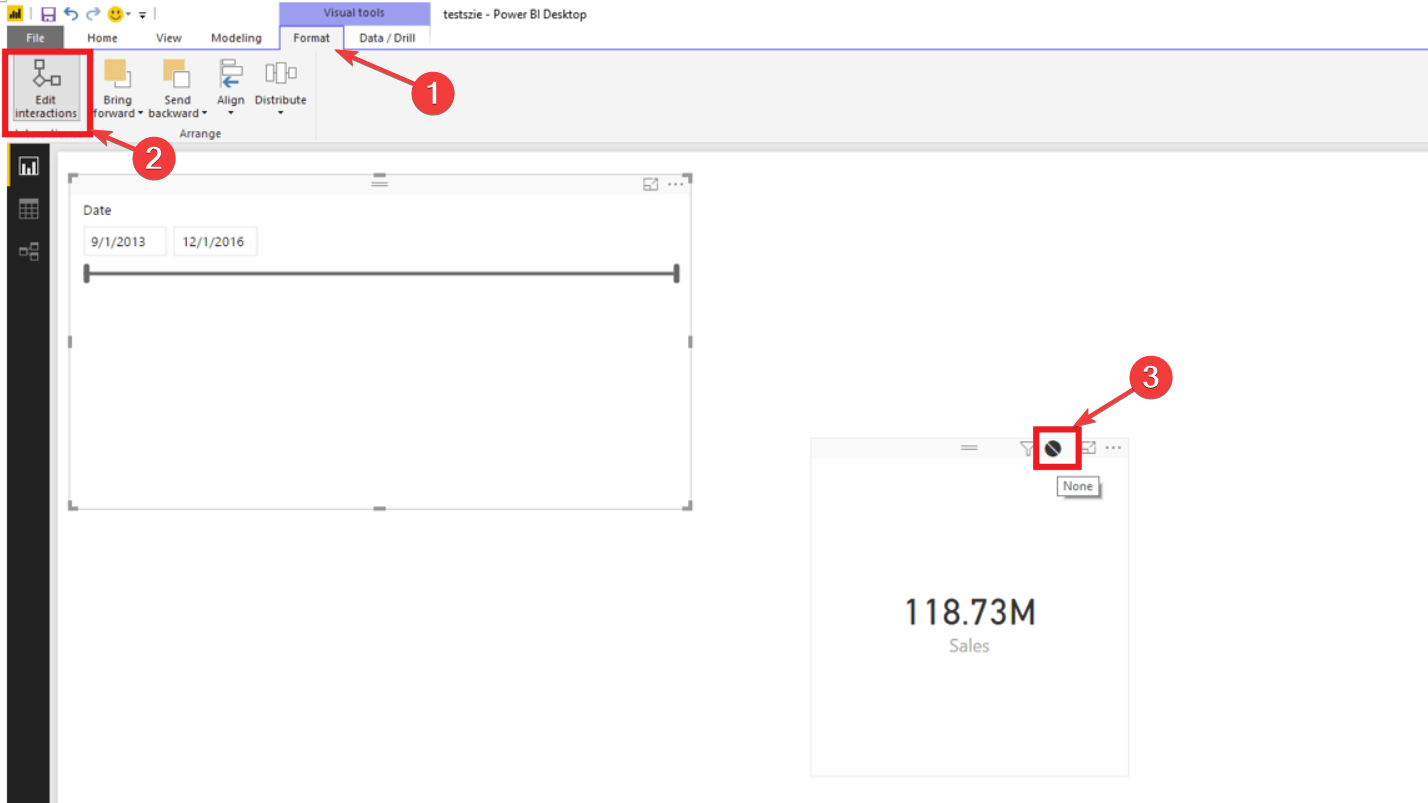
1. Use the Edit interactions feature
For the first issue, here are the steps you need to follow:
- Click on the timeline visual in your scenario.
- Turn on Edit interactions under the Format ribbon.
- Choose None in the Card visual.
So, a little twitch in the settings solved this issue, but different cases may have different solutions. So, now we explore another issue described by a Power BI user.
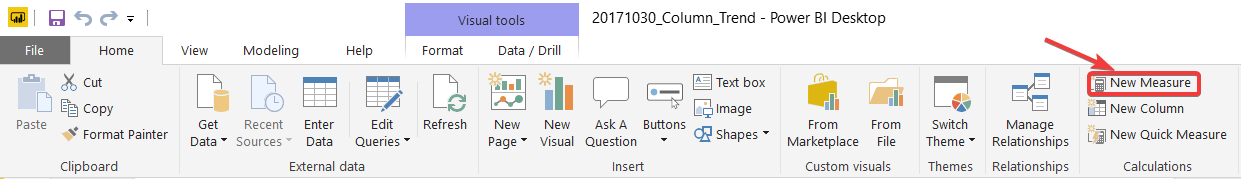
2. Write a new measure
For the second example, you need to write a new measure in DAX that returns BLANK () based on the selection from a slicer.
So, here you have it. You can disable filters in more ways than one. Now, all depends on your project.
How do you disable filters in Power BI? Do let us know in the comments section below.
Read our disclosure page to find out how can you help Windows Report sustain the editorial team. Read more


Improve this guide


User forum
0 messages