6 Best Infographic Makers [Online & Desktop Software]
Unlock your creativity with these top infographic makers
Key notes
- To make a large presentation with complex data easier to understand, use one of the best infographic software presented below.
- Our first solution, along with the other apps, features already-made templates and presets that help you save time.
- If you want a free tool, you can use the one we included here or choose a free trial from any of the software from our list.
- When choosing infographics software, think at one that comes with plenty of visual effects, like the ones from our top choices.

Why you can trust Windows Report ✅ Every product & service is tested in real-world conditions, by real people, for real people. Find out more about how we test, review & rate.
Whether you’re a marketer, educator, presenter, or simply someone looking to create visually engaging content, having access to the right infographic maker software can make a significant difference in the quality and impact of your designs.
In this article, we will explore the best infographic makers available, both as online tools and desktop software.
So, let’s dive in and discover the perfect tool to bring your ideas to life and captivate your audience with compelling infographics.
What to consider when choosing an infographics maker tool?
Infographics can help capture the viewer’s attention better than using text alone, push traffic to your site, help users create visually interesting stories, or to understand things in a simpler way.
Choosing the right infographics maker to do all that can be tricky. Here are some important factors to consider:
- Ease of use – It should be easy to navigate, with drag-and-drop functionality and pre-designed templates that simplify the design process.
- Customization options – Allows you to customize colors, fonts, layouts, and other design elements to match your brand or style preferences.
- Library of visual elements – Offers a wide range of graphics, icons, charts, and other design elements that suit your specific needs.
- Collaboration and sharing – Should have real-time editing, commenting, and sharing options that facilitate teamwork and feedback.
- Export and sharing options – Allows you to download designs as high-resolution image files or PDFs, with the ability to share directly on social media platforms or embed them on websites or blogs.
Once you have checked these factors, take a look at this list of the best infographics software tools to use on your computer.
What is the best infographics software to use on a PC?
Adobe Creative Cloud Express – Best for professionals
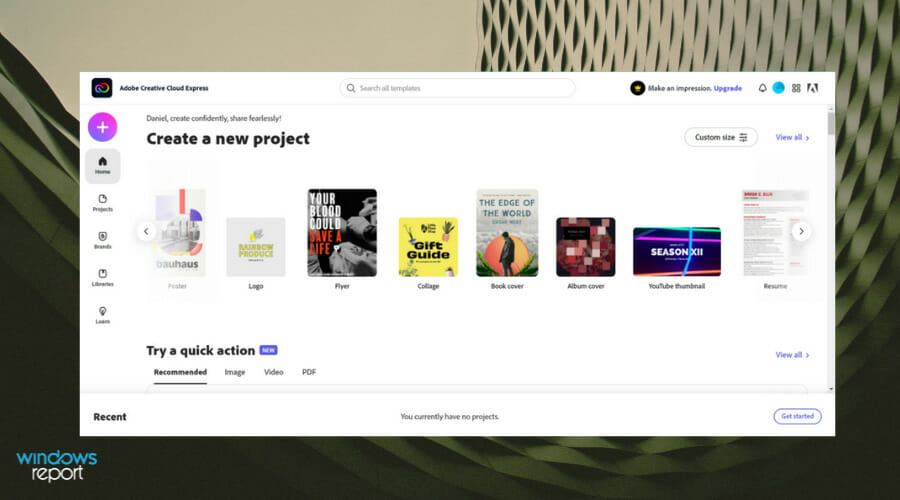
Adobe Creative Cloud Express is a great infographic maker for creating modern, eye-catching infographics with maximum impact for your audience and target readers.
Nowadays, nobody has enough patience to read large chunks of text. People want straight-to-the-point, fast-delivered information.
Since information presented as diagrams, images, and illustrations have higher chances of drawing people’s attention and remaining engraved in their memory, using the right infographics tool becomes paramount.
Adobe Creative Cloud Express comes with a very intuitive UI and plenty of graphics options. You can add your text and images and then edit and move them as you see fit.
If you’re in a hurry, you can select a ready-made template, fill in the empty boxes with data, select the font type and size, insert some impactful images, and you’re done in no time.
This Adobe tool’s built-in data visualization features (indicators, pie charts, line charts, bar charts, and pictograms) help users simplify complex ideas and make data more digestible.
Let’s quickly look at its key features:
- Multiple-device syncing
- Ready-made themes
- Multiple fonts
- Social media sharing
Adobe Creative Cloud Express
Create stunning infographics and instantly share your informative artwork with the world!Adobe Illustrator – Best for creating vector graphics

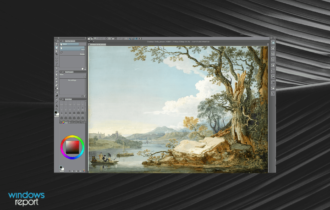
Did you know that you can use Adobe Illustrator for infographic design? This tool is another best infographic maker from Adobe.
This versatile tool can be used to design and create logos, icons, illustrations, special typography models, as well as infographics to convert large amounts of data into a digestible form.
If you’re tired of the basic pie and bar charts and you’re looking to step up your game, Adobe Illustrator is the right tool for you.
Use it to introduce data points and mesmerizing visual content to convey information easier to your target audience.
The Charts tool lets you design your own charts, while the Data Merge feature helps you keep data up to date without creating a new infographic presentation from scratch.
This feature is particularly useful if you want to highlight data evolution over time.
You can also design your own unique icons to draw your audience’s attention. The Shape Builder feature lets you design impressive and unique shapes that pop.
Let’s quickly look at its key features:
- Ready-made templates and presets
- Color synchronization
- Custom design support
- Real-time drawing
- Enhanced free distortion to modify shapes freely
- Auto spell-check
- Background save and export
- Onboarding resources and tutorials to get you started

Adobe Illustrator
Match your creativity with the best design software to create sophisticated infographics.Canva – Preloaded stock photos, fonts, and icons

Canva helps you create excellent graphics easily. It is suitable for every type of user’s needs.
This powerful tool is adequate for creating any graphic element. Canva has an extensive library of icons, images, and sources.
Regarding infographics, this resourceful design software includes thousands of templates you can use and handcraft your informational product in minutes.
Let’s quickly look at its key features:
- It’s free and full of free items and sources.
- It allows you to present relationships between two or more elements in an easy way. If you want to compare different data, Canva is an interesting solution.
- It offers thousands of graphics for social and infographics.
- It allows you to create infographics of different sizes suitable for each type of website.

Canva
Finding an all-in-one online infographic tool might take some time. That’s why this creative solution gives you complete design features now.CorelDRAW – Powerful set of drawing & editing tools

If you’re looking for the right tool to help you build an infographic, then the world’s most powerful graphic design software is the way to go. CorelDRAW stands out as a great infographics software.
CorelDRAW has powerful features that allow you to easily design stunning infographics to emphasize the data you want to showcase.
Whatever information you’re trying to convey, CorelDRAW makes it easy to create graphical elements that pop.
With text, arrows, and connectors combined with a plethora of vector-based design features, you can be sure to mesmerize your audience with eye-catching infographics.
Let’s quickly look at its key features:
- Vector illustration and the bitmap to vector tracing to create fully scalable, crisp-looking infographics
- Versatile shaping and drawing toolkit
- Stunning typography and a complex array of text tools
- Object management and object selection tools
- Powerful photo editing tools to adjust color, apply effects, remove imperfections, and more
- Supports a variety of file formats for import and export
- Library of professionally designed templates to kick-start your work
CorelDRAW
Experience AI-powered bitmap-to-vector trace technology and achieve fully scalable impressive infographics!EDraw Max – Best for creating flowcharts & mindmaps

EDraw Max is one of the best tools for creating infographics. It’s a platform to create infographics on Windows and Mac that allows you to create fully customizable graphs and interactive maps.
This infographic software allows you to share and publish infographics to the following used file formats, such as .png, .jpg, .html, .svg, .pdf, .word, .ppt, etc.
Let’s quickly look at its key features:
- You can use all 10000+ infographics icons and hundreds of premium templates with only a one-time payment
- It’s an offline infographic software; you can use it regardless of internet connection, so it’s far faster, more stable, and more powerful
- You can get access to libraries of infographic elements like charts, education, people
- You have at your disposal a variety of free templates to perfectly match the look and feel of your topics

EDraw Max
Create great infographics with the easiest all-in-one diagramming tool that serves all your purposes.Visme – Intuitive interface with customizable layouts

Visme is one of the most powerful and user-friendly infographic online platforms, offering a plethora of impressive features that make it a go-to choice for creating captivating and informative visual content.
It comes with a vast collection of professionally designed infographic templates catering to various industries, topics, and styles.
With its drag-and-drop editor, designing infographics is a breeze. You can easily add, resize, and arrange elements such as text, images, icons, charts, and shapes with simple clicks.
This infographics maker offers robust data visualization tools, enabling users to create interactive charts, graphs, and data-driven visualizations.
It allows you to bring infographics to life with eye-catching animations, transitions, and effects, making their content more engaging and memorable.
Let’s quickly look at its key features:
- Enables you to upload custom fonts, apply brand colors, and add logos
- Has a vast library of professionally designed templates, images, icons, charts, etc
- Powerful accessibility features such as alt text, screen reader compatibility, and more
- Allows integration of multimedia elements such as videos, audio, and animated GIFs
- Robust collaboration features allow team members to work together in real-time
Visme
Create presentations, infographics, reports, social media graphics, videos, and more without design expertise.Infographics tools are a very useful means of communicating different types of content, allowing you to involve and engage the public on rather difficult topics.
In this guide, we explored some of the best infographics software and platforms that you can use on your computer.
Looking for infographic design software specifically for Windows, check out this guide to explore the list.
If you already tried any of them, tell us more about your experience so that we can make this article even better.
Read our disclosure page to find out how can you help Windows Report sustain the editorial team. Read more


Improve this guide


User forum
0 messages