13 Best System Resource Monitoring Tools for Windows PCs
Keep resource consumption in check for best performance
Key notes
- System monitor tools for Windows 10 and 11 fully diagnose your OS’s performance.
- PC resource monitoring software collects information on system temperature or CPU usage.

Keeping track of your system resources is relatively simple in Windows 10 and Windows 11. However, some users prefer using third-party applications to monitor system resources because they offer a better and more straightforward user interface.
If you require complete data for your system performance and processes, using these tools can offer detailed reports for CPU usage or temperature, RAM usage, or hard drive memory.
What does a Resource Monitor do?
There are various ways to monitor resource consumption on Windows. The simplest option is to use the built-in Task Manager. It lists the CPU, Memory, Disk, Network, and GPU usage on the computer and is a free system monitor in Windows 10.

Along with that, it allows users to terminate applications and programs that hog the system resources and cause it to slow down.
But it doesn’t offer much information on critical aspects, making it slightly difficult to identify things, and this is where third-party tools come into the picture. We have listed the best available Windows Resource Monitors in this guide.
What is a Resource and Performance Monitor?
Windows has two built-in tools, the Resource Monitor and the Performance Monitor, both equally useful and handy when troubleshooting performance-related issues with the computer.
The Resource Monitor allows you to view how the various system resources are being consumed, for instance, RAM and CPU. It has a separate tab for each and also plots the resource consumption on a graph for better understanding.

The Performance Monitor, as the name suggests, is used to analyze the performance of the computer and how the various programs and processes run. It provides the option to view this data both in real-time as well as go through the available logs for past performance analysis.

However, if you’re looking for a dedicated tool to monitor your system resources, we have gathered here a neat list of programs that you need to check out. Also, some of the options here can be used as a Remote System Monitor, while a few offer a Windows 10 system monitor widget.
Which are the best system resource monitoring tools?
Paessler PRTG – Detailed data

Paessler PRTG, the best Resource Monitor in Windows 10 to download, is an all-in-one software that provides complete monitoring services for your PC, applications, network, and more. Basically, it entails the IT infrastructure at your fingertips.
Anyone should know that monitoring system resources is a must-do task for any PC. So, keeping track of your hardware components using this third-party software can give you detailed data about CPU usage or other processes.
Moreover, Paessler offers the possibility to track processes through features like built-in alerting technology, cluster failover solution for safety, real-time maps or dashboards, distributed network monitoring, and a multi-user interface.
To get a better idea, the software monitors your PC components’ performance using different sensors that show how fast the processor goes. As an example, an SNPM CPU load is a sensor used to monitor your network channels and see helpful data.
Thus, keeping an eye on the system resources contributes to better functionality on your device, and also monitors traffic-related information at a glance.

Paessler PRTG
Consider a monitoring software that handles your PC performance seamlessly. Try out Paessler PRTG!Site24x7 – Comprehensive Windows Monitoring Tool

Managing your Windows systems efficiently requires constant insight into performance metrics, uptime, and resource usage. Site24x7 from ManageEngine offers an all-in-one monitoring solution designed specifically to keep tabs on your Windows environment with ease and precision.
Site24x7 provides detailed real-time monitoring of Windows servers and applications, helping you track CPU, memory, disk usage, and network performance, all from a centralized, cloud-based dashboard accessible anywhere.
The tool automatically detects your Windows devices, simplifying setup and letting you focus on what matters: optimizing system health and preventing downtime.
With customizable alerts and threshold settings, Site24x7 ensures you’re notified instantly if any key performance indicators fall outside your preferred range.
The intuitive interface displays clear graphical reports and trend analyses, enabling IT teams to proactively troubleshoot before small issues escalate.
Key features include:
- Automatic discovery and monitoring of Windows servers and applications
- Real-time performance metrics for CPU, RAM, disk, and network
- Cloud-based dashboard accessible remotely
- Custom alerting and threshold management
- Historical data and trend reporting for capacity planning
- Scalability to support networks of any size
Whether you’re a sysadmin or an IT manager, Site24x7 offers a powerful yet user-friendly tool to maintain seamless Windows system operations.

Site24x7
Monitor performance in real time, get instant alerts, and prevent downtime effortlessly with Site24x7.ManageEngine OpManager – Best system resource monitoring tool

If you need real-time monitoring for all the devices on your network, we recommend using a professional tool such as ManageEngine OpManager.
First, with this tool, you don’t need to add the devices manually because it automatically detects and adds them to your software in the right category.
Then it applies one of the preexisting templates to all of them based on their category. OpManager has 9,500 device templates out-of-the-box and it supports over 53,000 vendor templates.
And these templates each contain a set of performance monitors that will help you supervise their health in real time.
Of course, you can customize the list of monitors as you need and then see the graphical representation of the output for each component right on your dashboard.
You may also select filters or thresholds and set the software to be alerted when these parameters are not on par with your specifications.
This will help you take action and troubleshoot the respective Windows computer before the situation gets critical.
Here are some of its most important features:
- 9,500 device templates out-of-the-box
- Real-time monitoring of all key metrics
- Graphical representation of the performance monitor’s output
- Cloud-based dashboard accessible from anywhere in the world
- The solution is scalable to any network size

ManageEngine OpManager
Follow the real-time metrics of all the Windows PCs in a network and manage your network easily!AIDA64 Extreme – Provides comprehensive monitoring

AIDA64 Extreme is a comprehensive system analyzer and benchmark tool which includes some powerful features such as CPU, RAM, GPU, motherboard diagnostics, and system functionalities monitoring.
It can also offer benchmarks and can provide a detailed audit of your system resources.
Its interface is very intuitive and similar to Microsoft Console Management. You can consult a large number of activity indicators.
This software also allows you to stress test all your components in a large variety of combinations.
You will also have great support from AIDA’s team at your disposal. Download and give it a try. Learn more about its diagnostics, stress testing, and reporting in our AIDA64 Extreme benchmark guide.

Aida64
Get real-time diagnostics about an overclocked system and support to measure your device’s performance.Wise System Monitor – Offer a simple UI

Wise System Monitor, one of the best System Monitors in Windows 10, is another useful tool that can help you monitor system resources. The main tool allows you to see all your running processes and see how much of the computer resources they use.
There’s also a Hardware monitor included that allows you to see all hardware-related information. You can see detailed information about your motherboard, CPU, graphics card, memory, etc.
If you want, you can also see relevant information about your operating system.
As for the resource monitor, it is at the bottom right corner, just above your Taskbar. The tool will display information such as download and upload speed, RAM and CPU usage, as well as CPU temperature.
If you want to see detailed information, you just need to click a certain field, and you’ll see which applications are using most of that resource.
Wise System Monitor is a decent tool for monitoring your system resources. The tool keeps all information easily accessible, so it’s perfect for basic users.
Wise System Monitor also allows you to see your system information which can be rather useful for some users.
This is a free and simple application, and the only flaw might be the lack of any customization.
If you’re looking for a straightforward application to monitor system resources, be sure to check Wise System Monitor.

Wise System Monitor
See detailed, but easy-to-understand information regarding your system and hardware status with this free tool.Rainmeter – For easy monitoring

Rainmeter is a simple open-source tool that lets you monitor your system resources. The tool will display small gadgets on your desktop so you can easily monitor your CPU and RAM usage.
In addition, you can check the hard drive space as well as the speed for upload and download with the Resource Monitor.
You can easily choose which gadgets you want to display, and you can easily move the gadgets anywhere on your screen.
Although Rainmeter is simple to use, it offers extensive support for customization. By customizing this tool, you can add new skins and a new feature to the application.
If you’re not a developer, there’s an active community that is constantly developing new skins and features.
Rainmeter is available in a portable version, so there’s no need to install it on your PC to run it.
The tool offers all the basic features that you need, but if you want to use the full potential of Rainmeter, we strongly suggest that you try using different skins for the tool.
This is a great tool for system monitoring, but basic users might be turned away by extensive customization.
FreeMeter – Graphical representation of resource consumption

If you’re looking for a reliable and easy-to-use tool to monitor system resources, you should consider FreeMeter. The application has a simple user interface, and it will show you all the necessary information in the form of graphs.
The tool offers comprehensive performance information that will help you tackle any issue in order to get the best experience possible.
FreeMeter shows easy-to-follow reports and real-time status updates of your system uptime as well as hard drive space.
Along with that, it monitors CPU usage. The professional version can display kernel CPU usage and user CPU usage separately.
In terms of Internet connection, the software is able to monitor both wireless and Ethernet speeds separately.
It can also help with troubleshooting and fixing latency issues. FreeMeter monitors network ping and helps with slow connections.
FreeMeter offers a free version as well as a premium one with a larger set of features. Give it a try and see if it meets your needs.
Solarwind Network Performance Monitor – Best for network monitoring

This multi-solution company can offer multi-vendor network monitoring on your own PC that shows network connection data at a glance.
Using this comprehensive software, you can see detailed information for network performance aspects like hardware internet issues or cloud server monitoring.
According to your monitoring needs, it’s easy to control your IT infrastructure with a detailed view of physical network performance or cloud server data.
More so, you have absolute control over the network processes and document every matter regarding the connectivity with key metrics and drill-down analysis meant to cover everything.
It is also possible to monitor and analyze Cisco devices’ networks from the comfort of your home. More exactly, you have access to availability or performance graphics in one view.
If you need to detect Cisco routers or other devices, it can’t be more simple than automatically discovering and identifying the network.
Furthermore, for more insights, you can run packet inspections and see network slowdown problems and their causes.
Analyzing over 1.200 applications to see the response time or classifying network traffic gives you the perfect methods to resolve the issues.
Finally, you will efficiently manage the network performance with instant notifications when issues arrive and critical health data for network hardware.
Process Explorer – A Task Manager alternative
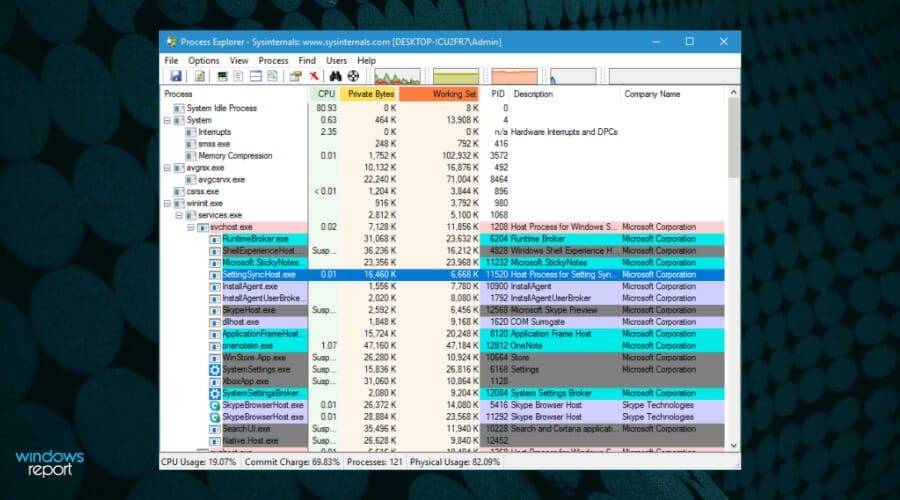
Process Explorer is designed as a Task Manager alternative, and this tool will list all your active processes. Using this tool, you can easily end a process or change its priority.
In addition, you can also monitor system resources by using Process Explorer.
There are four graphs available in Process Explorer, and each graph represents a single resource. If you want detailed information, simply click one of the graphs, and a new window will appear.
From there, you can see the summary or check the CPU, memory, I/O, and GPU usage individually.
This tool also comes with a small graph that will appear in your Taskbar so you can constantly monitor your system resources.
Process Explorer is a great Task Manager alternative, but it can also be used to monitor system resources. This application is free and portable, so be sure to give it a try.
TinyResMeter – Lightweight application for older devices
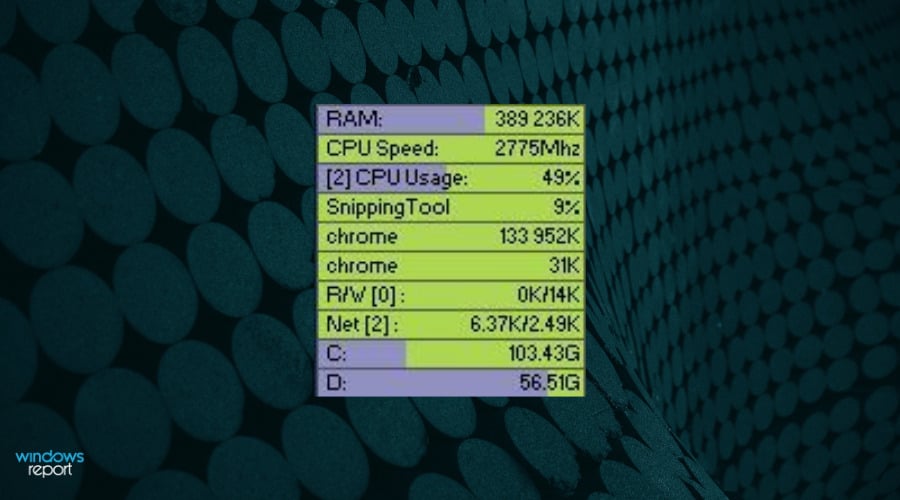
Another simple tool that allows you to monitor system resources is TinyResMeter. This is a portable and lightweight application, so it can run on almost any PC.
The application doesn’t have a visually appealing user interface, but it will show you all the necessary information.
System information can be displayed in a horizontal or vertical menu. If you want, you can customize the font and colors, but you can also customize available fields.
You can also enter your own labels for the fields. As for available fields, you can display RAM, CPU speed, CPU usage, network speed, etc.
TinyResMeter comes with a bit outdated interface, but it can still be useful. The tool allows you to right-click each field and see detailed information about it.
For example, by right-clicking your hard drive, you can see the total amount of space, label, system type, and all other necessary information.
As for the flaws, the tool feels a bit sluggish at times, and there’s also one visual bug that we noticed.
Every time you hover your mouse over the TinyResMeter, it will turn black, and after a second, it will turn back to normal. This is a small bug, but it can be irritating at times.
TinyResMeter is a simple and portable application that lets you monitor system resources. Despite its simplicity, the application feels a bit outdated, and it has a few minor bugs.
CPUID HWMonitor – For detailed system information

If you want to see detailed information regarding your system, HWMonitor is the perfect tool for you.
This system monitor tool is free, and it will allow you to monitor your hardware and see all the relevant information.
The application comes with a hardware tree that you can expand in order to see the necessary information. Using this tool, you can see important information such as temperature, fan speed, and utilization.
Although you can see the information about your motherboard, CPU, graphic card, and hard drive, it seems that you can’t see information regarding your RAM or network connection.
Unlike other tools on our list, HWMonitor doesn’t offer a real-time graph, and in order to check your system resources, you’ll need to keep the HWMonitor window open.
This tool offers a lot of information about your hardware, and it can be useful if you want to know more about your components. As for resource monitoring, the tool offers almost all necessary information, but some users might have issues finding the desired information.
HWMonitor is a decent tool, it’s free and portable, but it doesn’t show any information regarding your network connection or RAM, which is its biggest flaw, in our opinion.
Moo0 System Monitor – Easily customizable

Moo0 System Monitor is a free and portable tool for monitoring system resources. This tool consists of several graphs that show you all the necessary system information.
Using this tool, you can see CPU usage and temperature, GPU usage and temperature, amount of free memory, HDD temperature, network speed, etc.
If you want, you can also add additional fields to show more information.
The tool supports some customization, and you can change the size of the tool or its transparency. You can also auto-hide this tool after a certain period of inactivity.
The tool also supports many different color schemes, and you can even set the color scheme to change automatically.
Moo0 System Monitor is a great tool, it’s simple and portable, so it will be perfect for both basic and advanced users.
We have to mention that this tool can sometimes take up a lot of space on your screen depending on the number of fields that you have, so keep that in mind.
Overall, Moo0 System Monitor is a great tool, and you should definitely check it out.
TaskbarMeters – To quickly identify high resource consumption

Taskbar Meters is a set of applications that allows you to monitor your system resources. There are three applications available, and they all work the same way.
Each application will position itself in your Taskbar, showing your resource usage.
Every application is designed to change color in the Taskbar, so you’ll quickly notice if you’re using too much of your resources.
Using these tools, you can monitor your CPU, RAM, and disk usage, which is more than enough for primary users. Then, if you want, you can adjust the colors or update the frequency of each tool.
We have to mention that these applications use a simple method to display the usage of your system resources.
Unfortunately, using this method, you can’t see the exact numbers, which can be a flaw for some users.
The only flaw of these tools is the lack of ability to show detailed information about CPU, RAM, or disk usage, which can turn away some users.
How do I check my system performance?
- Open the Performance Monitor, expand Data Collector Sets, and double-click on System under it.

- Right-click on System Performance and select Start.

- This will trigger a 60-second test to analyze the computer’s performance.
- After the period, expand Reports, select System under it, and then double-click on System Performance.

- Now, double-click on the report listed here.

- You can now view the system performance and identify what’s consuming the maximum resources and other critical information.

If you want to monitor system resources, feel free to use any of these tools because they will provide the necessary information.
It is essential to maintain your computer’s health. The first step is to monitor the system resources accordingly, and this list is more than sufficient to provide the best options for everyone and every PC.
You can use the Resource Monitor in Windows 10 for logging data or try the other third-party tools here. This information can be beneficial when choosing say a browser because you’ll be able to tell how Opera compares to Firefox in CPU consumption.
If you found some problems, here’s what you should do if the system runs low on resources on Windows 10/11.
If you want to keep track of your network usage at all times, then you might want to try Net Speed Monitor for Windows 11.
We’d like to hear which of these tools you prefer and why. Use the comments section to get in touch with us.
Read our disclosure page to find out how can you help Windows Report sustain the editorial team. Read more


Improve this guide

User forum
5 messages