How to add a secondary axis in Power BI [EASY STEPS]
![]() 2 min. read
2 min. read
![]() Updated on
Updated on
Share this article
Improve this guide
Read our disclosure page to find out how can you help Windows Report sustain the editorial team. Read more

Creating charts in Power BI Desktop is one of the main features of this tool, but quite a few users are encountering issues in creating the Y-axis (secondary axis).
One user reported the following on the official Power BI forum:
Currently using Power BI Desktop (just downloaded last week). I’m trying to create chart with secondary axis (Y-axis). However, in the tool, when I select from Visualization pane, ‘Y-Axis’ then ‘Show secondary’, nothing happens. In the video, I see that underneath that option when it is selected, there are other options to select like position it on ‘right’ side.
So, when trying to create a chart with a secondary axis (the vertical axis of the chart) through the usual method, nothing happens. Fortunately, the issue has a very easy solution.
Steps to add a secondary axis in Power BI
Add a metric to the line values
To solve the issue quickly, you simply add a metric to the line values.
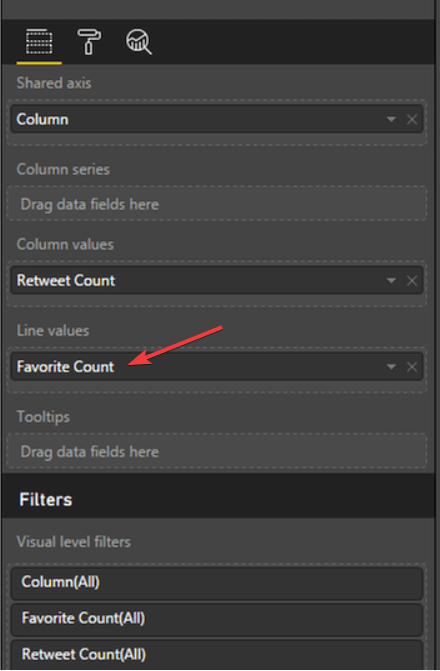
- Click on Favorite Count.
- Select the metric you prefer for your axis.
Conclusion
So, that’s about it. Adding a metric to Y-axis will allow you to create a chart with a secondary axis.
Leave your answer along with any other questions in the comments section below.
RELATED STORIES YOU NEED TO CHECK OUT:


User forum
0 messages