Microsoft Planner Gantt Chart - How To Create It in 4 Simple Ways
![]() 8 min. read
8 min. read
![]() Updated on
Updated on
Share this article
Improve this guide
Read our disclosure page to find out how can you help Windows Report sustain the editorial team. Read more
A Microsoft Planner Gantt chart can help you get a timeline view of a project’s tasks and sub-tasks. That way, you can effortlessly visualize the progress compared to the overall timeline planned for the project.
However, doing so in the Microsoft Planner app is a tricky task. The new tool makes it a bit easier but its accessibility and adoption are minimal.
In this detailed guide, I’ll show you various methods to create a Gantt chart in the Planner app. Let’s get started!
How To Create a Microsoft Planner Gantt Chart
I’ve covered four methods in total:
In the New Planner App
The new Planner app might not be available in the Microsoft 365 Home portal’s Apps menu. You’ll have to access it from Microsoft Teams. Find below the complete steps:
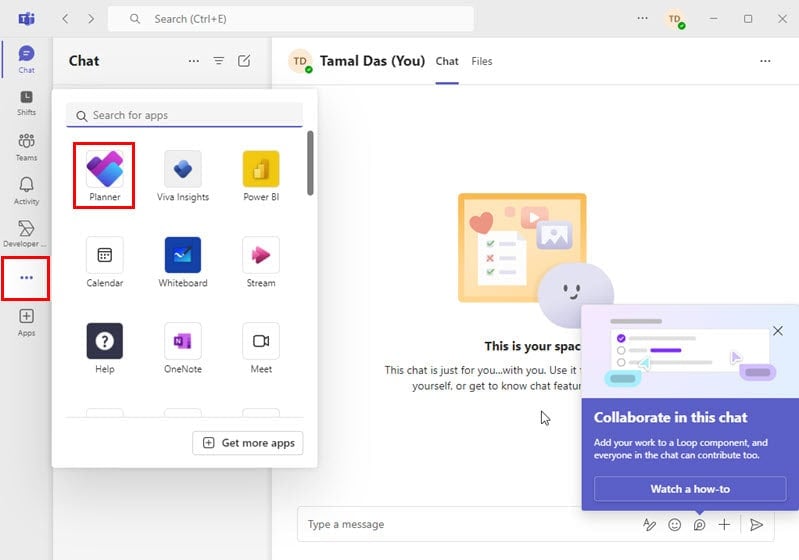
- Open the Microsoft 365 Teams app or the New Teams app.
- If you’re using an unpaid Microsoft 365 or Office plan, you might not see the new Planner at all.
- Click on View more apps or the three dots menu icon in the left side navigation panel.
- You should see the New Planner at the top of the list of additional Teams apps.
- Click on that to open Planner in Teams.
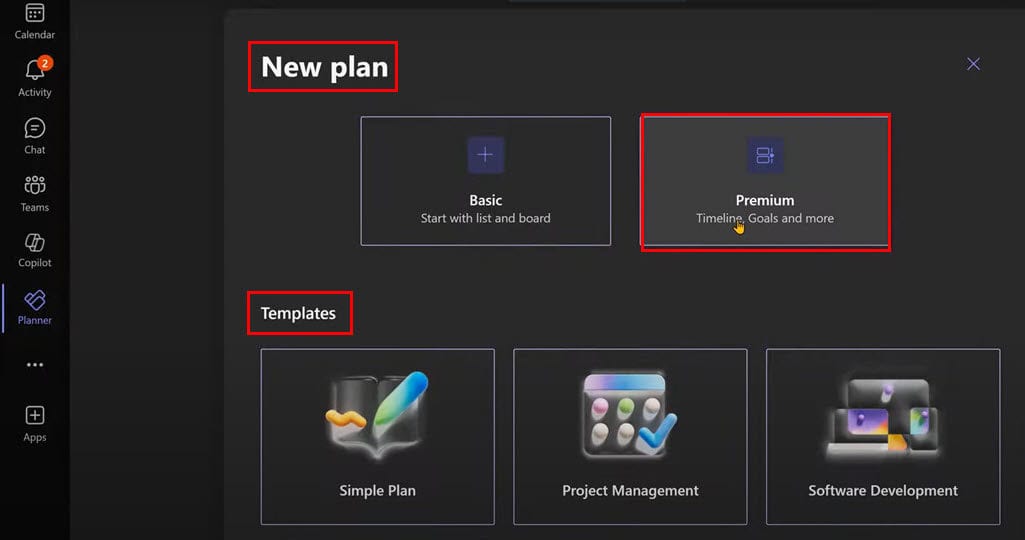
- Select the New plan button on the home screen or the left-side navigation panel.
- Choose Premium on the New plan page.
- Now, select an appropriate project structure from the Templates library, like Project Management, Software Development, Sprint Planning, Marketing Campaign, etc.
- Follow onscreen instructions to set up the project in the Planner app.
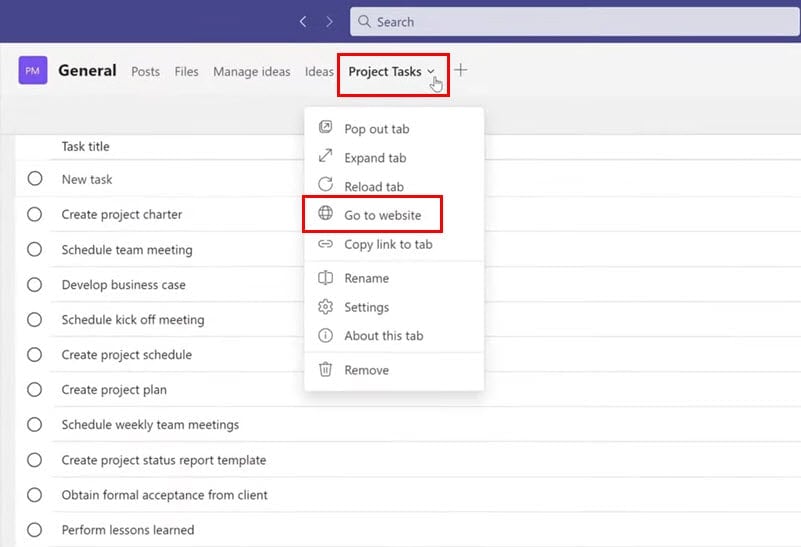
- At this stage, if you wish to use the app in a separate browser tab, click on the Project Tasks drop-down list on the menubar.
- Choose Go to website from the context menu.
- Let’s say you’ve chosen the Sprint Planning template.
- It’ll create a list of example tasks.
- Click on a task and add dependencies as you need.
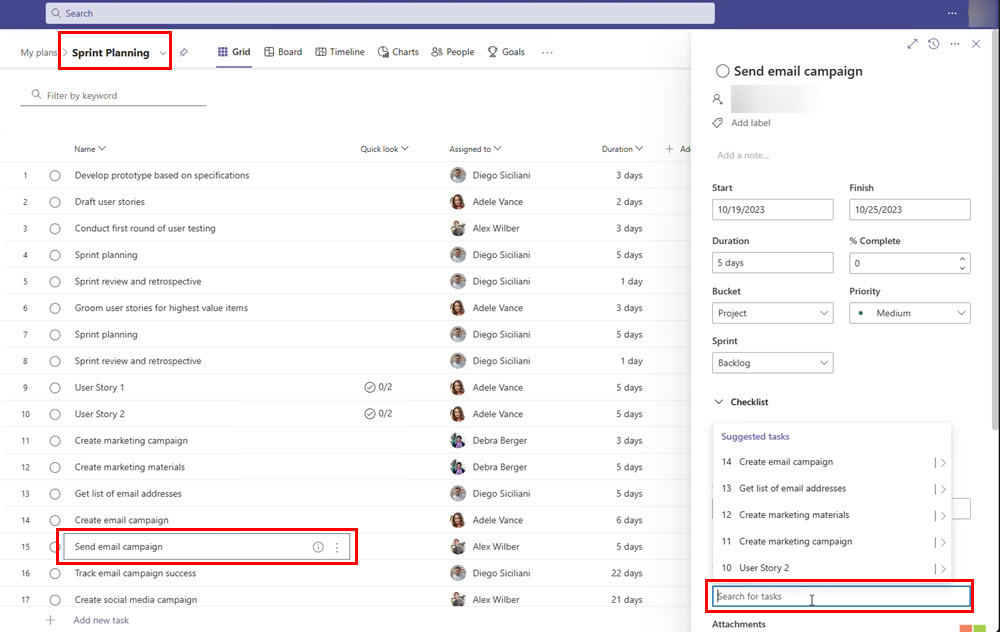
- Repeat this for a few other tasks as well.
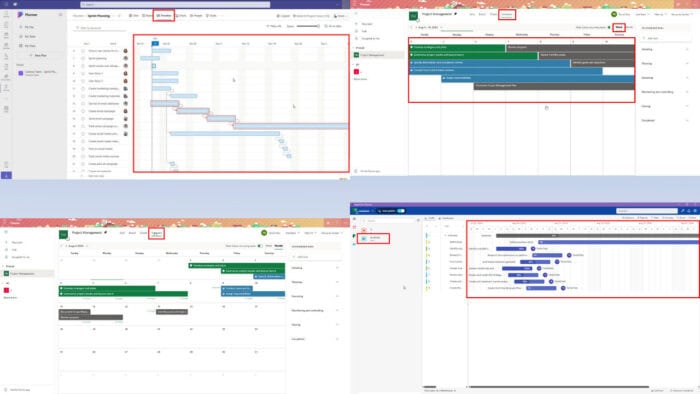
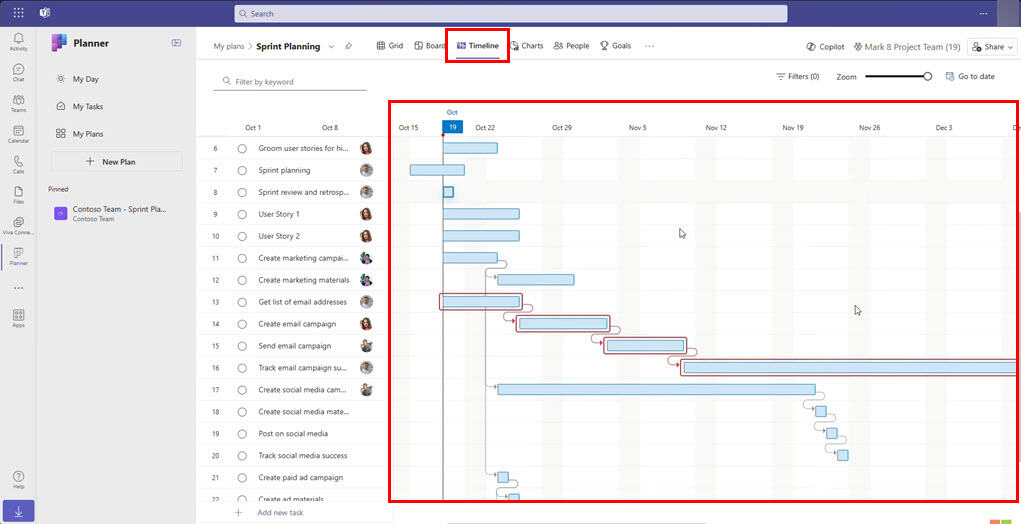
- You should see the Timeline tab on top of the task list.
- Click on that to create the Gantt chart view.
Limitations
There are some limitations to the Timeline feature though:
- Not available if you choose the Basic plan option.
- Timeline is also not available in the legacy Planner app.
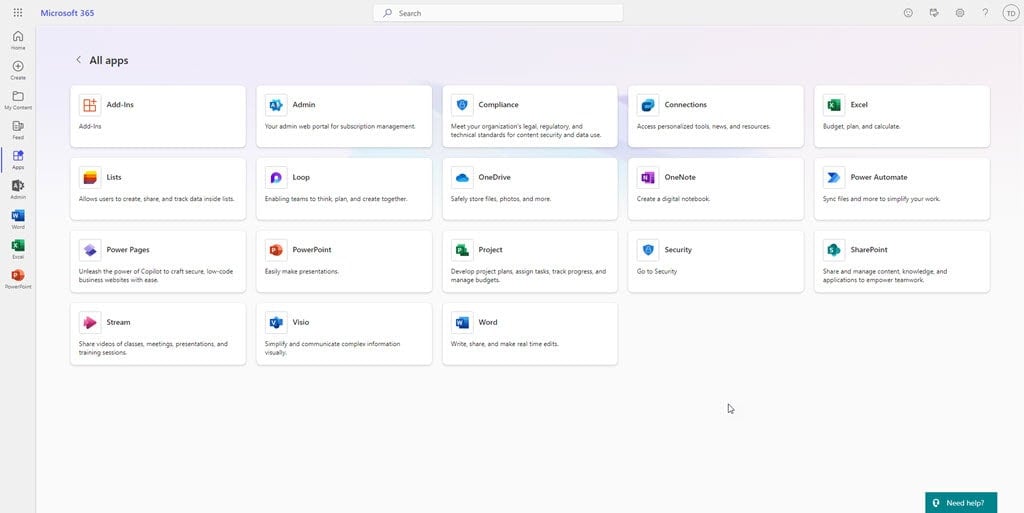
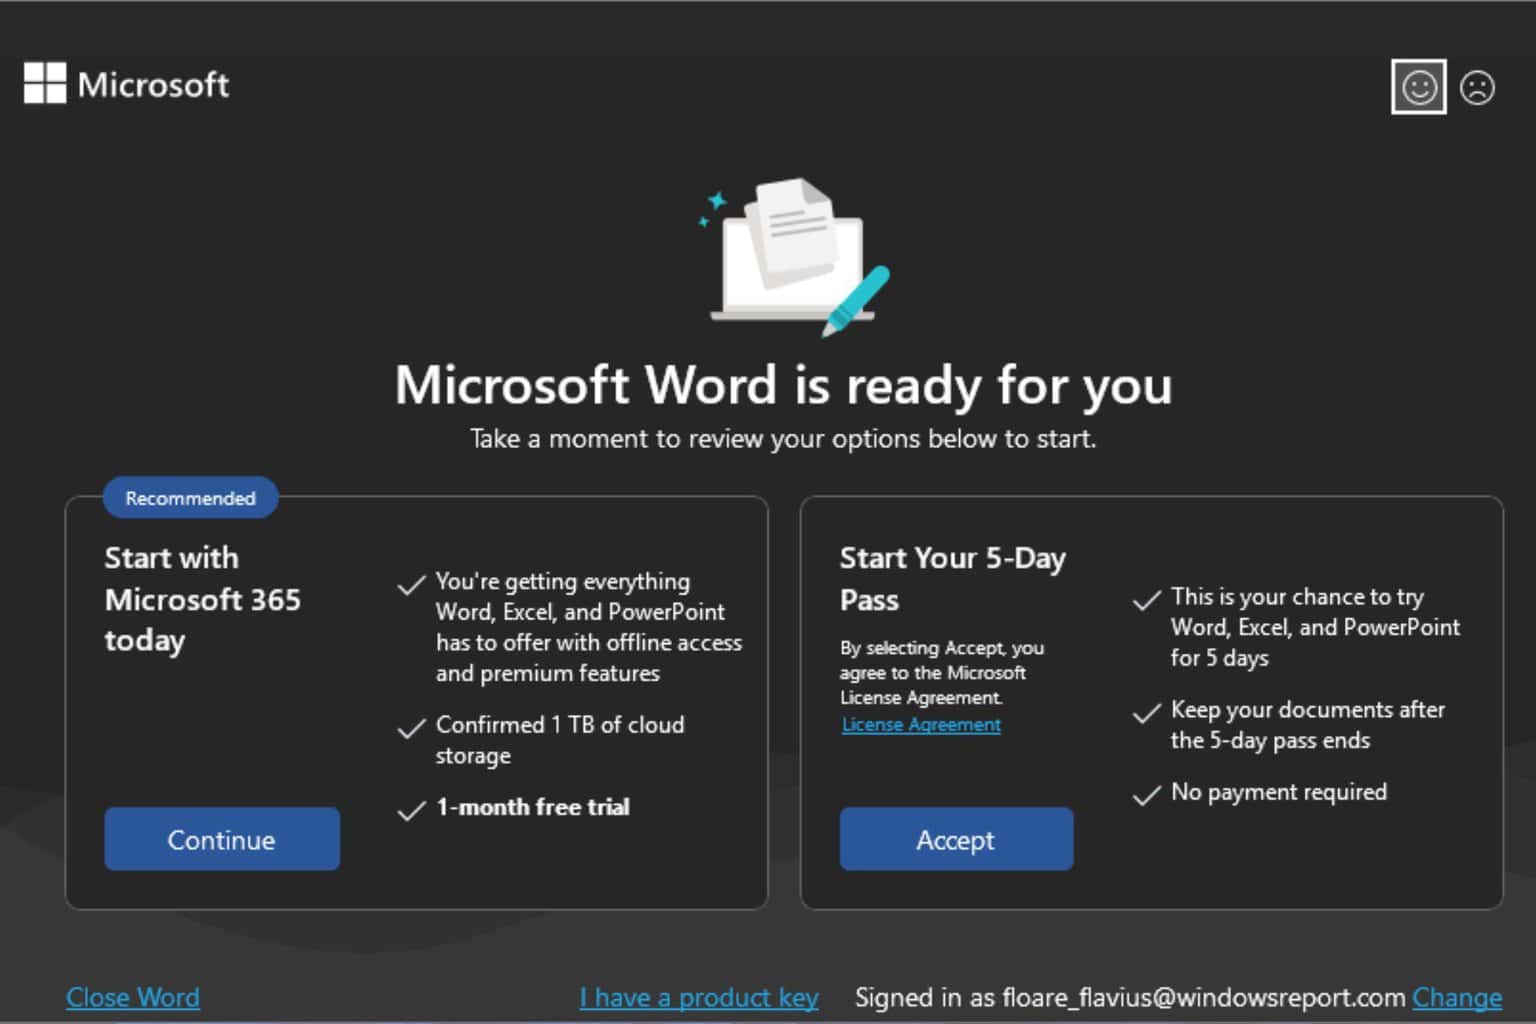
- Subscribing to a premium subscription for the new Planner app as an individual user is a complicated process. It often fails too. You can try to get the 1-month free subscription. However, Microsoft takes you through a 20 minutes long sign-up process. In the end, you’ll discover that it has given you access to the Microsoft Project and not the new Planner app. For example, look at the screenshot below:
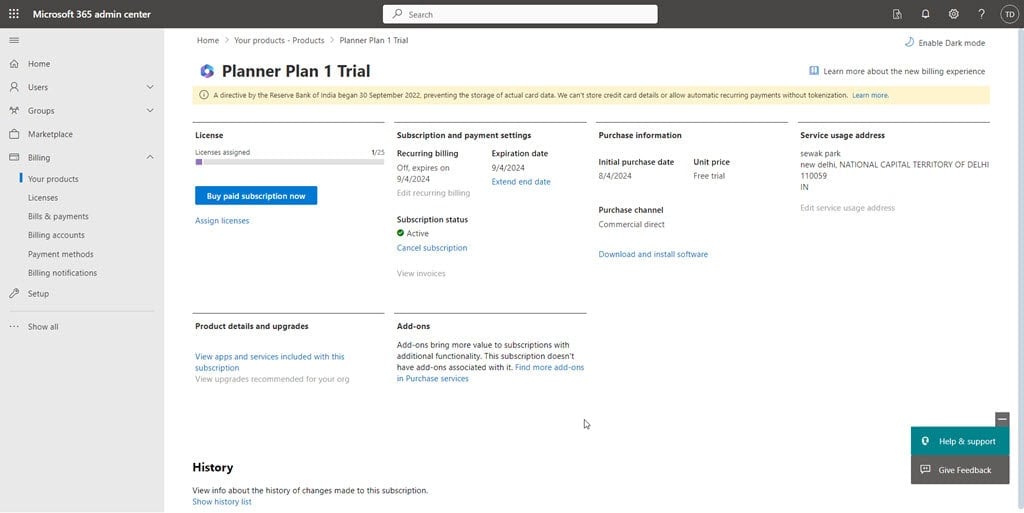
- The Planner premium subscription however shows Planner Plan 1 Trial according to this screenshot:
- You might only be able to use the new app through an organization’s Microsoft domain with E5 or better subscription packages. The Microsoft 365 admin might need to set it up for you.
Considering this, you may need to learn how to set up the Gantt chart in the legacy app.
In the Legacy Planner App
The Timeline or Gantt chart view isn’t natively available in the legacy Planner. Find below some workarounds you can use:
- Open the legacy Planner from Microsoft 365.
- You’ll see all your projects and task lists on the home screen or Planner Hub.
- Click on a project card, like Project Management in this exercise.
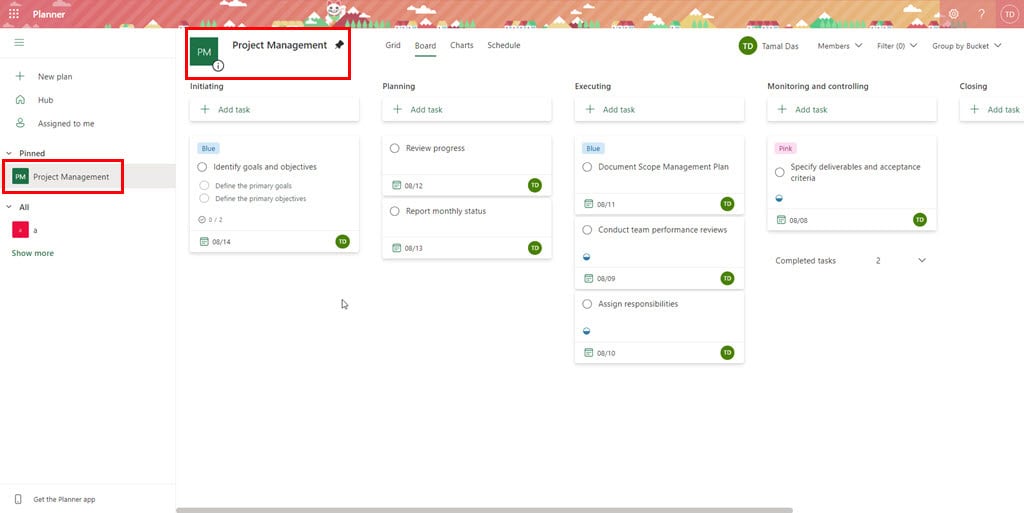
- Select the Charts tab on the top.
- You’ll see a page of four charts. The configurations of the charts will depend on the project you’ve selected.
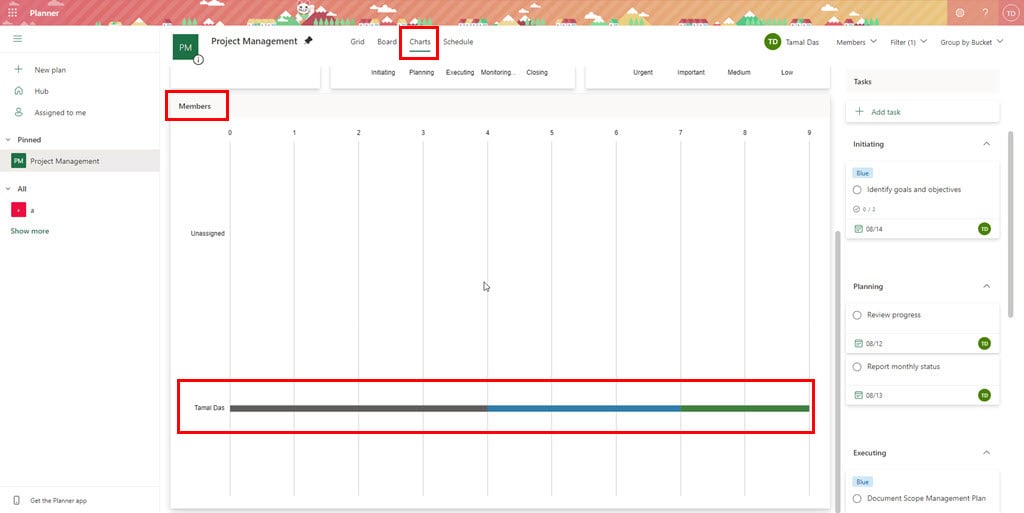
- At the bottom, you’ll find the Members or Plan chart showing a timeline-like visualization of the tasks.
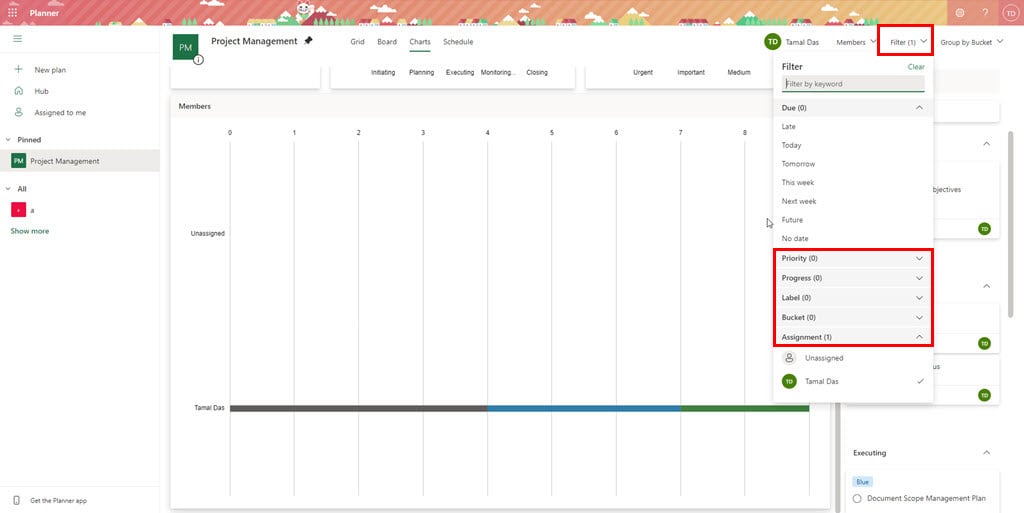
- You can further enhance this timeline view workaround by choosing different items from the Filter drop-down menu in the top-right corner.
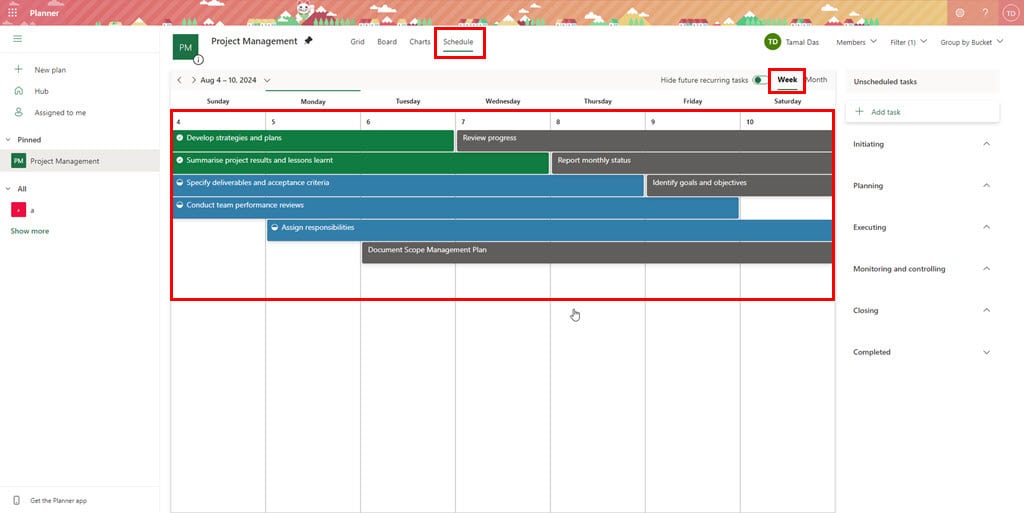
- To get a project progression view for the selected task list, go to the Schedule tab on the top.
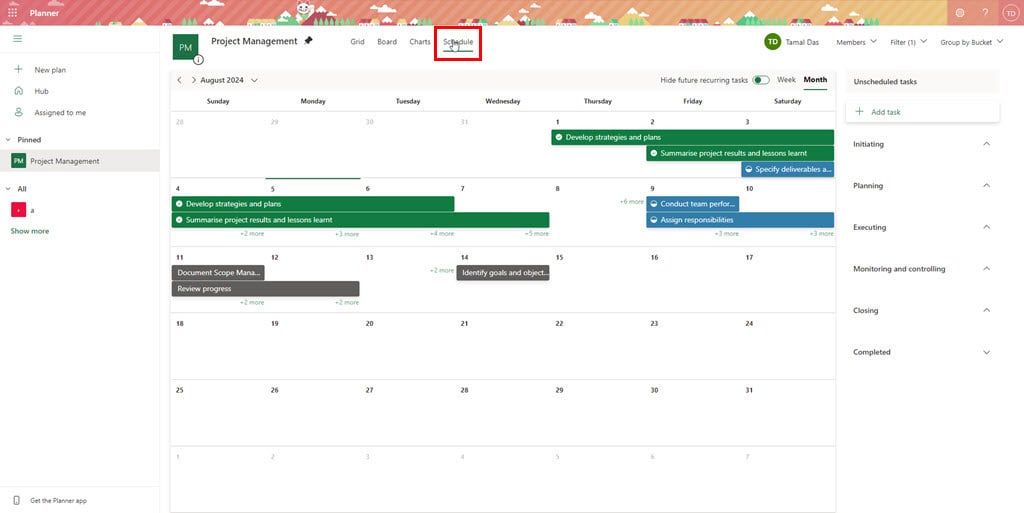
- There, you can switch to a Week or Month view to get a closer and better timeline view.
Using Power Apps
You can also use a Power Apps solution to convert board or grid views to a Gantt chart. You’ll be using the no-code app development platform to set it up.
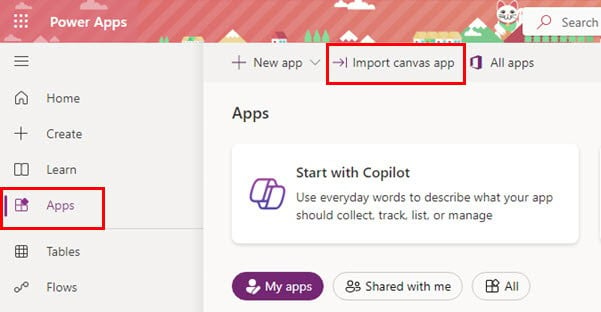
- Log in to the Power Apps tool from Microsoft 365.
- Go to the Apps menu from the left-side navigation panel.
- Click on the Import canvas app link from the toolbar on the right side.
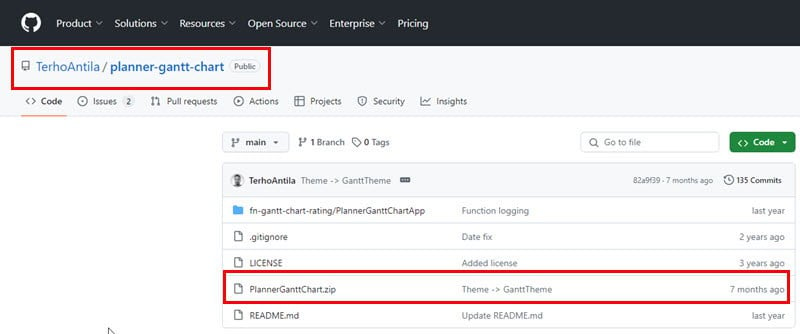
- Visit the TerhoAntila/planner-gantt-chart GitHub portal.
- Click on the PlannerGanttChart.zip file.
- You should see the Download raw file button on the right edge of the Code ribbon. Click on that.
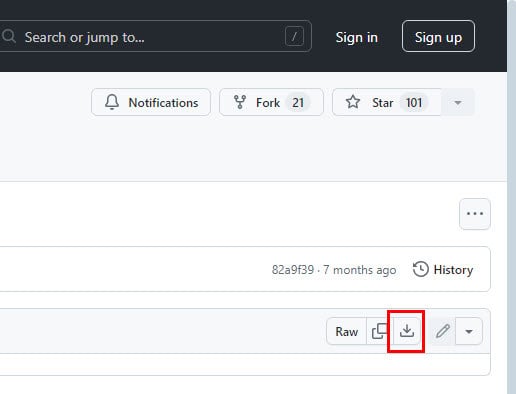
- You’ll download the ZIP file on your PC.
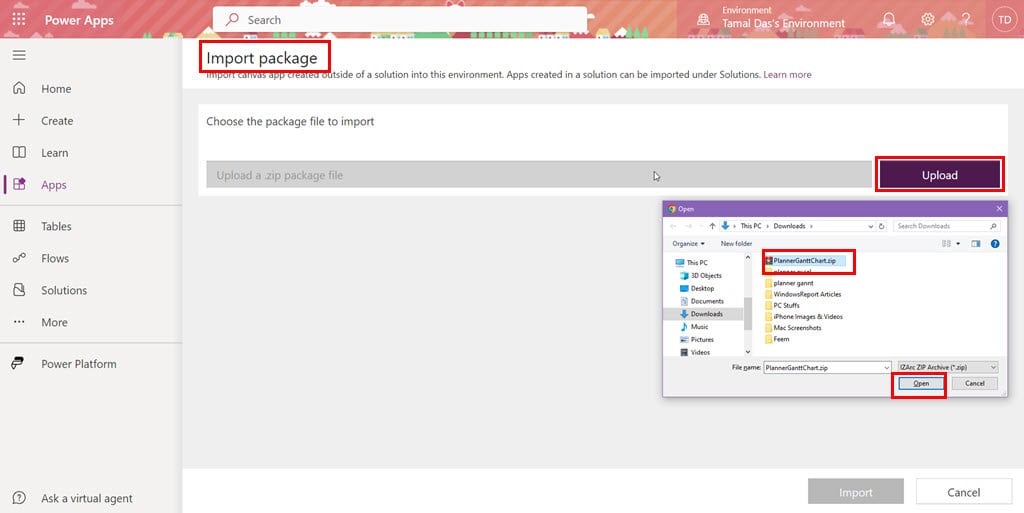
- Now, go back to the Import package portal of Microsoft Power Apps.
- Click on the Upload button.
- Select the PlannerGanttChart file you downloaded earlier and hit the Open button in the file browser.
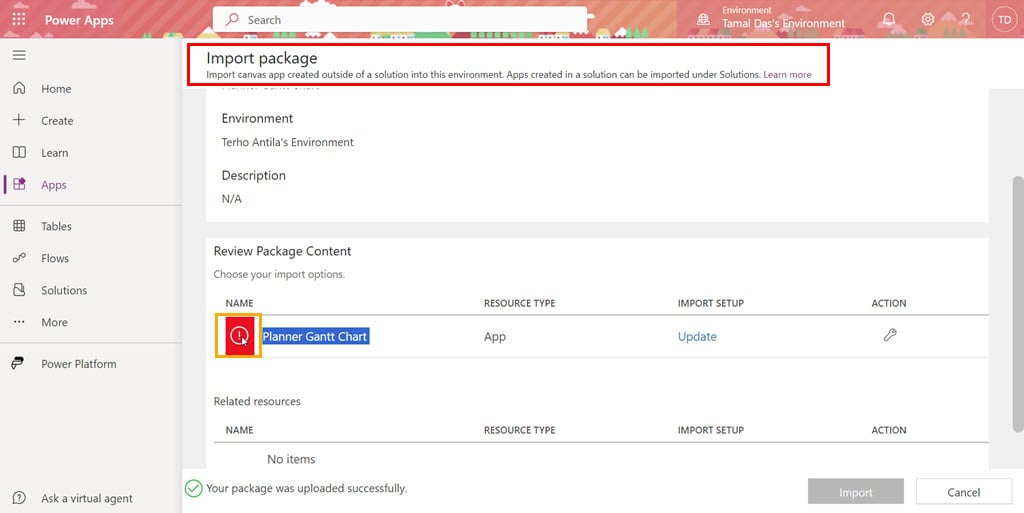
- Wait until you see the Your package was uploaded successfully notification.
- Under the Review Package Content section, you should see the Planner Gantt Chart app package.
- Click on the red warning sign.
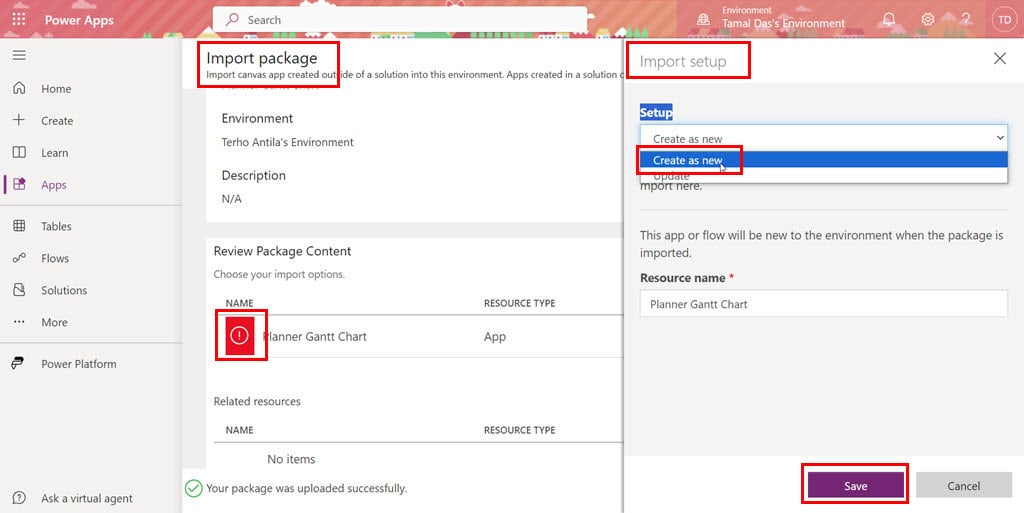
- The Import setup navigation panel will open on the right side.
- Click on the Setup drop-down and choose the Create as new option.
- Press the Save button.
- The Import button on the Import package screen will become active. Click on that.
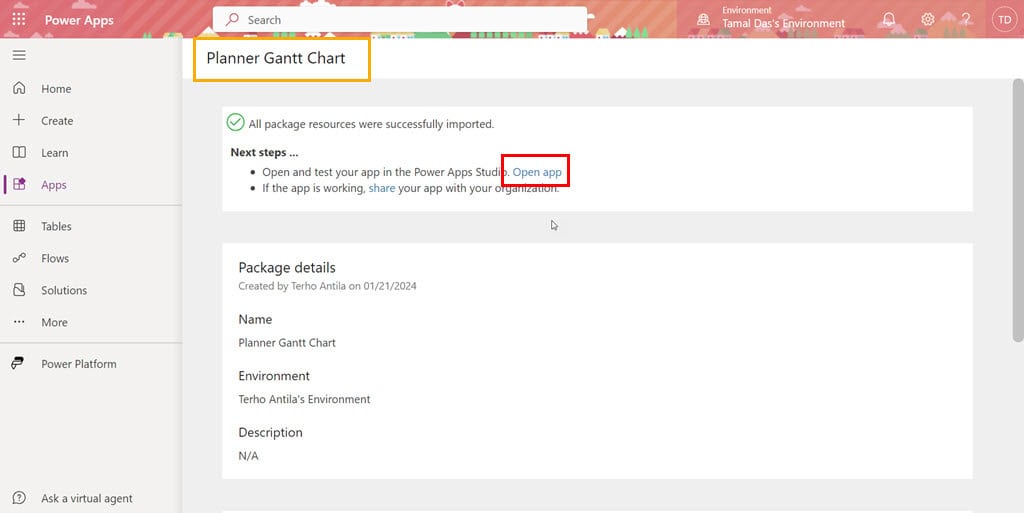
- Once done, you should see the All package resources were successfully imported notification.
- Click on the Open app hyperlink below the Next steps … section.
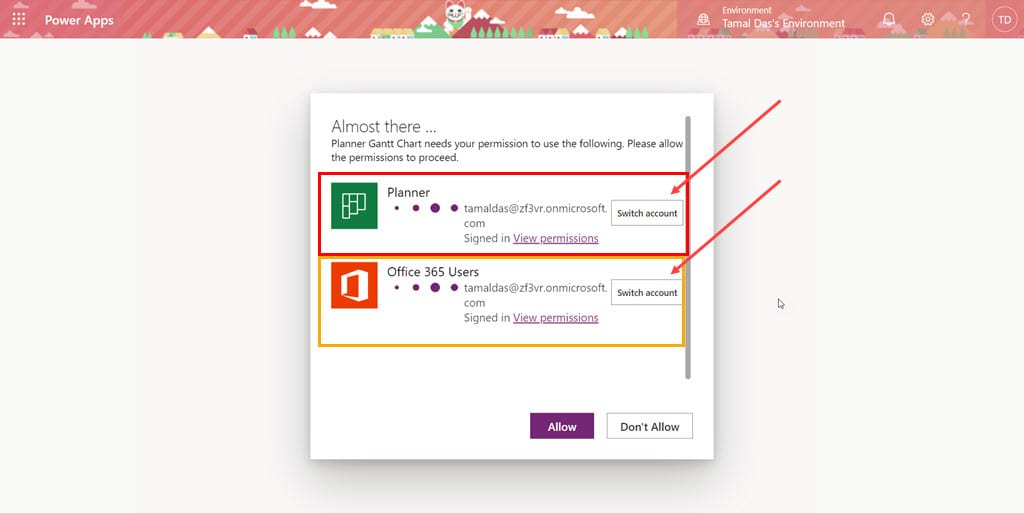
- The app package will automatically try to fetch data from the Planner app and Office 365 Users portal.
- These items should show the same MSFT login emails.
- If the emails are different, click the Switch account buttons to select the appropriate ones. Both the MSFT log-in emails must be the same.
- Once confirmed, click the Allow button.
- The Planner Gantt Chart will open in Editing mode on Power Apps.
- Click F5 or Preview the app button in the top right corner.
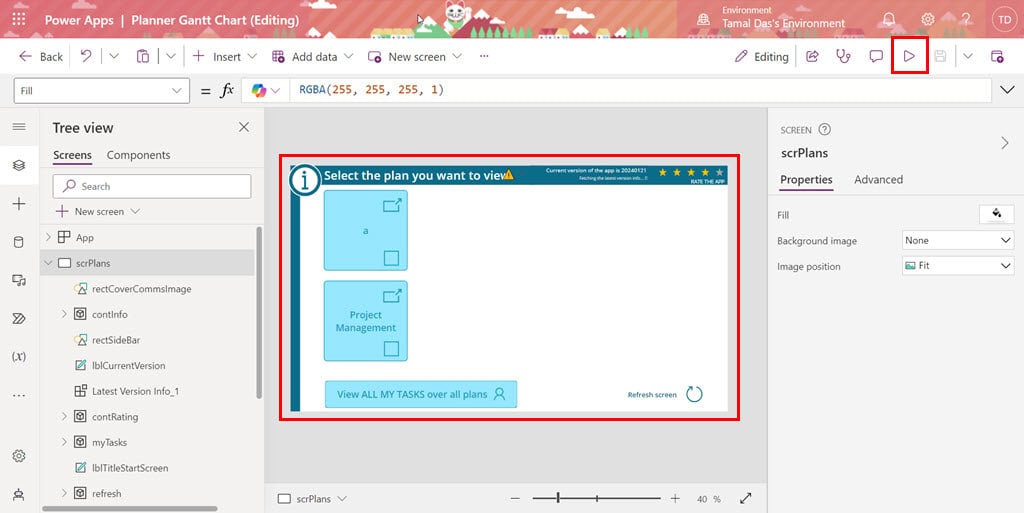
- The app will become online.
- Its user interface will show all of the task lists and projects from your Planner app profile.
- Click on a task list, like the Project Management in this example.
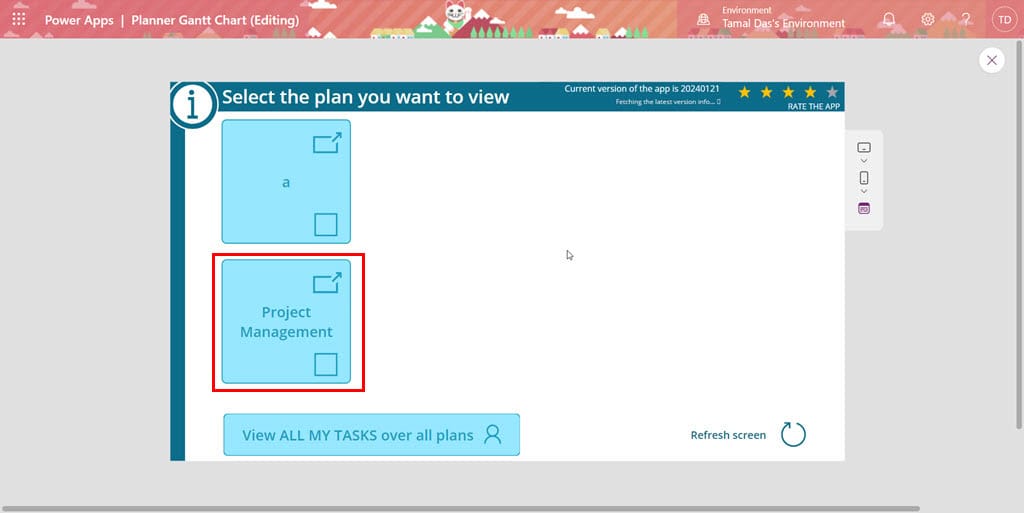
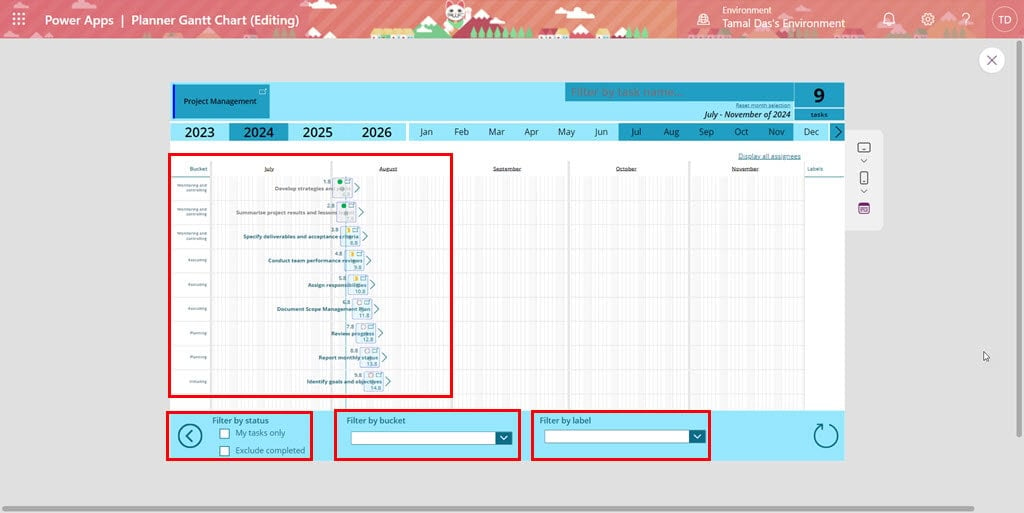
- You should now see the Gantt chart.
- In this custom app, you can use the Filter by status, Filter by bucket, and Filter by label options to further customize your Gantt chart.
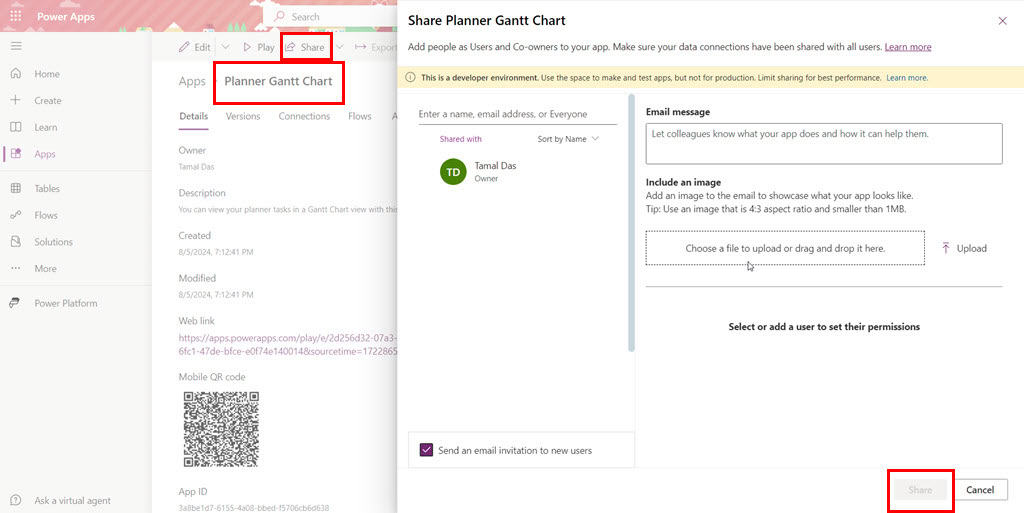
- Click the Close icon in the top-right corner.
- To share the app with collaborators, click on the Share button.
Using a Third-Party App
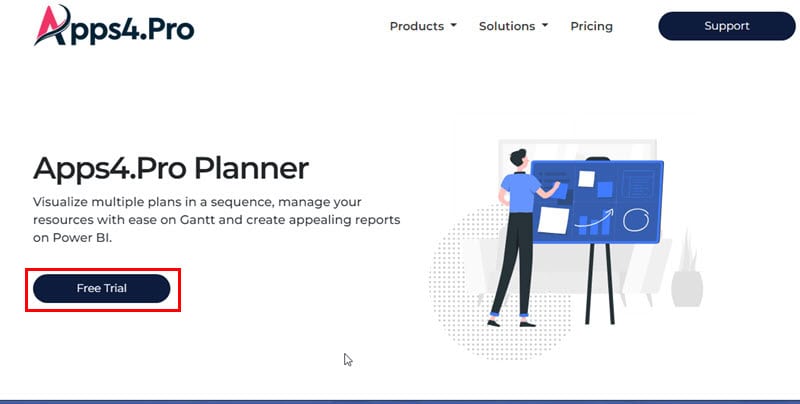
The Apps4.Pro Planner tool allows you to create Gantt charts from Microsoft Planner data, like projects, task boards, etc. It automatically imports, configures, and visualizes tasks in a timeline provided there are sufficient start times, date times, and statuses in the imported task boards.
When I used it to create the timeline view, it offered a 14-day free trial. You can download the free trial app from the Apps4.Pro Planner official portal.
It might download additional Microsoft .Net packages if the compatible resources aren’t available on your Windows PC.
Once installed and ready, follow these steps to import your Planner account into the app and create the Gantt charts you need:
- Launch the Apps4.Pro Planner using the Desktop or Start menu icon.
- Click on the Login button.
- The tool will launch the Microsoft log-in API.
- You should see all of your MSFT sign-on credentials in the API window.
- Select the account with which you’d like to log in.
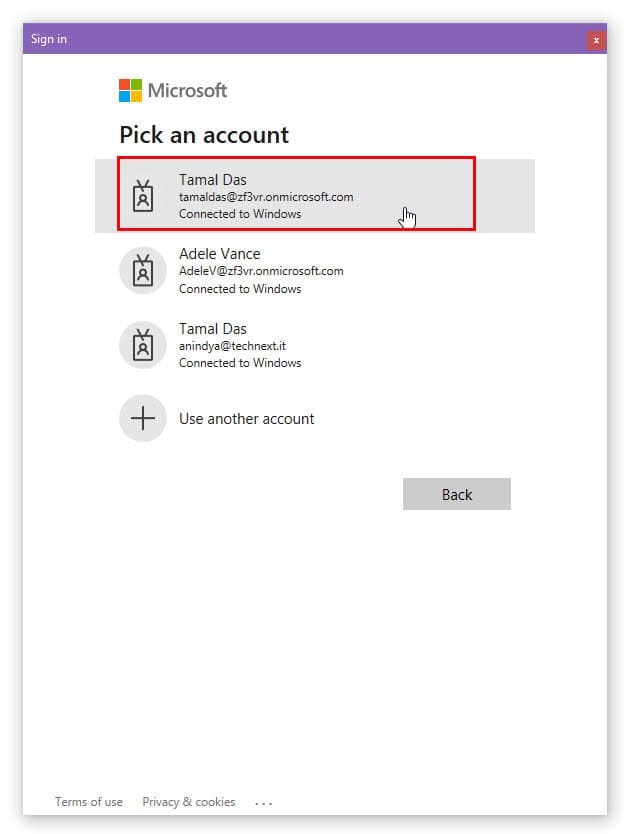
- The app should log you in momentarily.
- You might need to authenticate the sign-in using the Microsoft Authenticator or mobile phone OTPs.
- The tool will load its home screen where you should see all your previous Planner boards.
- Select a Planner board on the left-side navigation panel.
- You should instantly see the Gantt chart on the right side of the app screen.
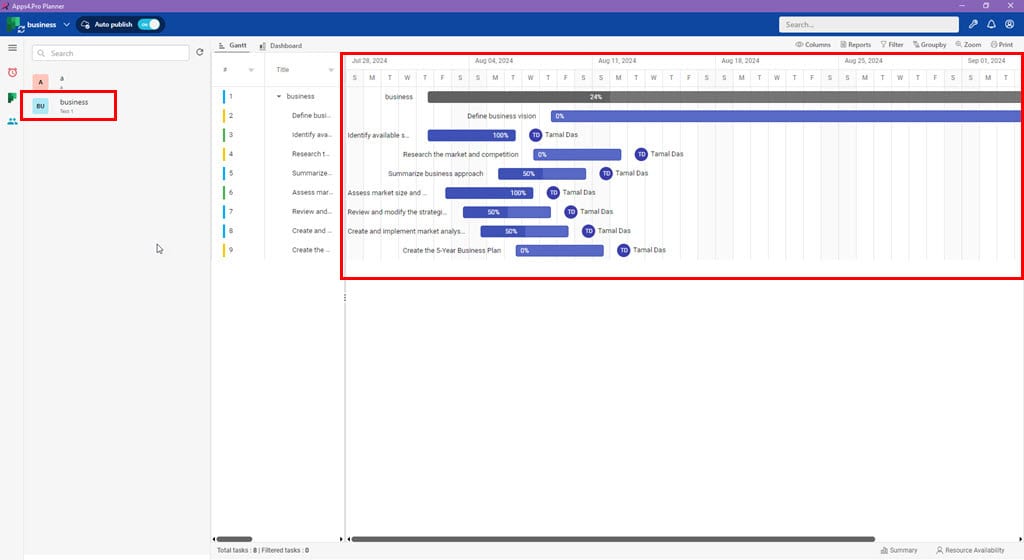
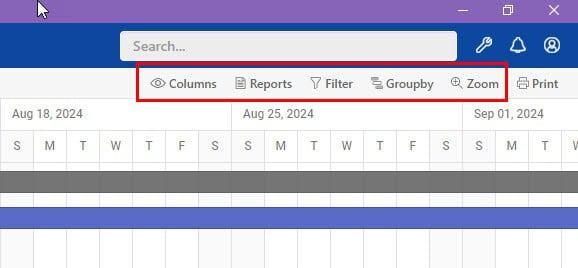
- Use the toolbar items, like Columns, Reports, Filter, and Groupby to customize the Gantt chart.
- Click on the Print button to start the export process as a PDF.
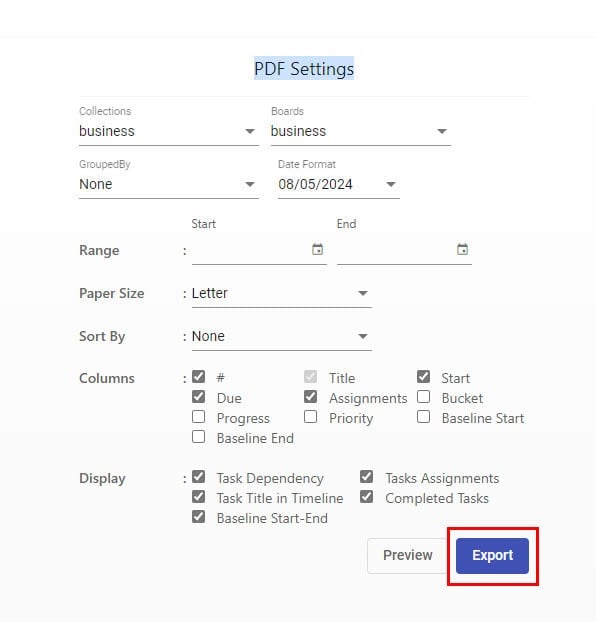
- You should see the PDF Settings dialog.
- Here, you can customize the visible items, like Range, Sort By, Columns, Display, etc.
- If required, also customize the Paper Size settings.
- Click Export to download a PDF copy of the Gantt chart.
Summary
So, these are all the tried and tested methods to create a Microsoft Planner Gantt chart in the new or legacy app.
If you find the Planner app falling short of features, you can also check out Edraw Project to create Gantt charts. You can also learn how to export data to Excel or export projects as a PDF.
If you want to enhance Teams with additional features we have a great guide on Microsoft Teams Kanban boards, so don’t miss it.
If this article helped you or you know any better methods, feel free to share your thoughts in the comments.


User forum
0 messages