14 years of Windows Market Share History: Yearly Review
Join us while we analyze Windows market share over the past years
8 min. read
Updated on
Read our disclosure page to find out how can you help Windows Report sustain the editorial team. Read more
Key notes
- Windows is constantly evolving, and new versions are released frequently.
- With each new version of Windows, the market share changes significantly.
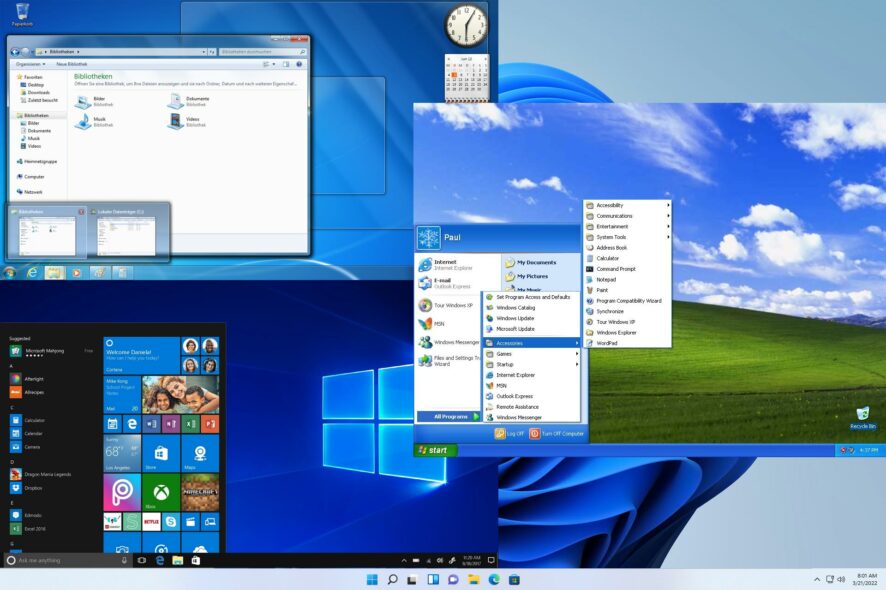
Windows had an interesting history over the years, and while it dominated the market in the 90s and early 2000s, that has changed in recent years.
Windows 11 market share is on the rise, but how did the market share look over the past years?
In today’s guide, we will take a closer look at Windows market share history over the last decades, so join us for an in-depth analysis.
Will Windows ever become obsolete?
No, Windows as a platform won’t become obsolete anytime soon. Certain versions of Windows will become obsolete, which is perfectly normal.
Until there isn’t a proper Windows replacement, Windows will remain a viable platform.
How did Windows’ market share history look over the years?
2009 – Slow rise of Windows 7
During the end of the 2000s, Windows XP was still the dominant Windows version, but it fell from 78.45% to 69.14% in 2009. In case you’re not familiar with it, we have a great guide on Windows XP features, so you can learn what made it so special.
This is somewhat expected since Windows 7 was released in late 2009, and it got 6.59% by the end of the year.
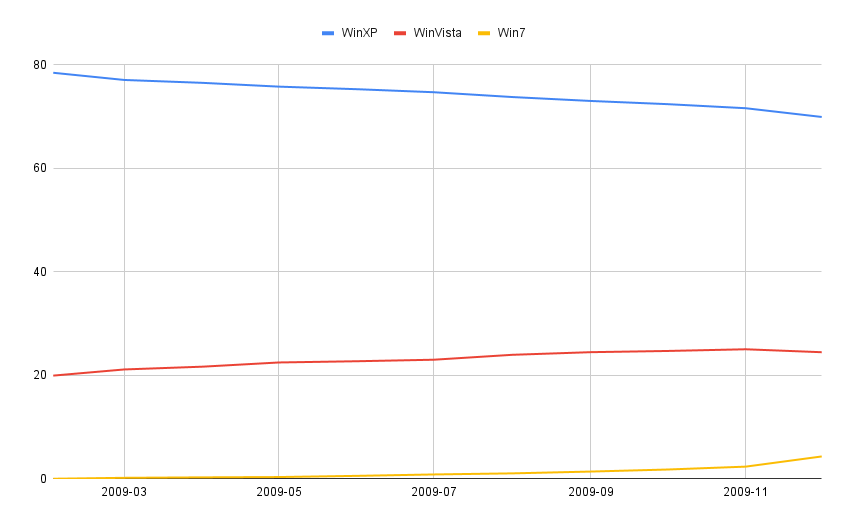
As for Windows Vista, it achieved its peak in October, but it was on the decline following the release of Windows 7. In 2009, it went from 19.93% to 23.38%, but its market share slowly declined.
2010 – Windows 7 overtakes Vista
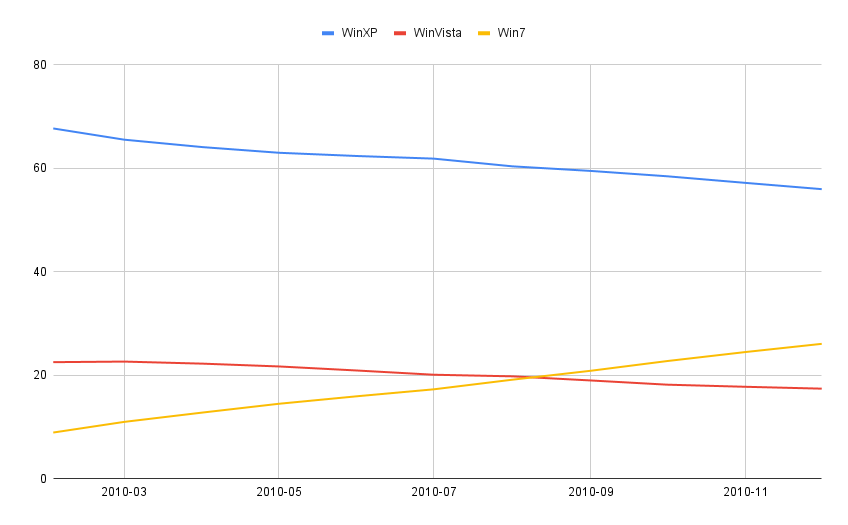
2010 was a great year for Windows 7, and it went from 8.93% to 27.98% during that year alone. It overtook Vista in August that year and become the second most popular Windows version.
Speaking of Windows 7, we have a great guide on how to upgrade Windows 32-bit to 64-bit in order to better utilize your hardware.
Regarding Vista, its market share dropped from 22.53% to 16.76% that year. Windows XP was still dominating the market, but it was declining. Regarding the market share, it went from 67.69% to 54.74% in a single year.
2011 – Windows 7 takes the number-one spot
In 2011, Windows 7 finally took over Windows XP as the most used Windows operating system in October 2011.
In just a year, Windows 7 went from 30.08% to 47.23%. Windows XP was declining, and its market share dropped from 53.01% to 40.35%.
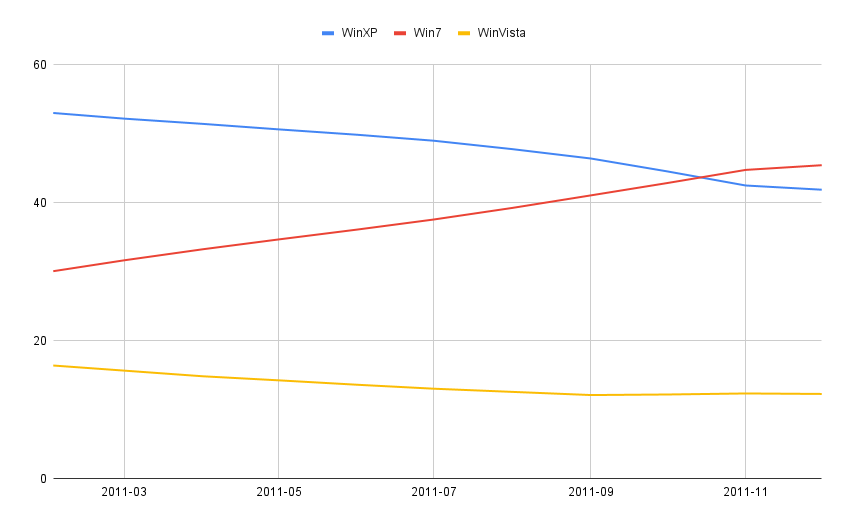
As for Vista, it was on a slow decline and it went from 16.41% to 12.05% during that year.
2012 – Windows 8 is released
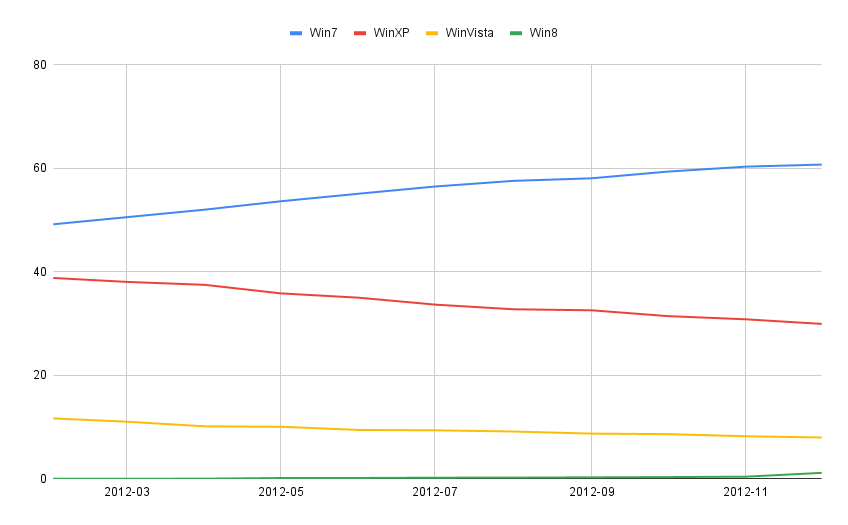
During this year, Windows 7 was still on the rise, going from 49.17% to 60.89% in a single year. Windows XP was on the decline, and it dropped from 38.8% to 29.12% in 2012.
Vista was on its way out, and its market share dropped from 11.66% to 7.73%. Windows 8 was released in late 2012, and over a couple of months, it got just 2.02% of the market share. To learn more about it, we suggest reading our Windows 7 vs Windows 8 guide to learn all its features.
2013 – Microsoft releases Windows 8.1 update
Windows 7 still dominated the Windows market, and during 2013 it kept the same market share. It went from 61.16% to 61.19%.
Windows XP was declining, and its market share dropped from 28.05% to 22.1%. Vista was also on the decline, going from 7.61% to 4.8%.
As for the newcomer, Windows 8 didn’t achieve any major success, and it was greeted by harsh criticism from the users. During 2013, its market share went up from 2.92% to 9.08%.
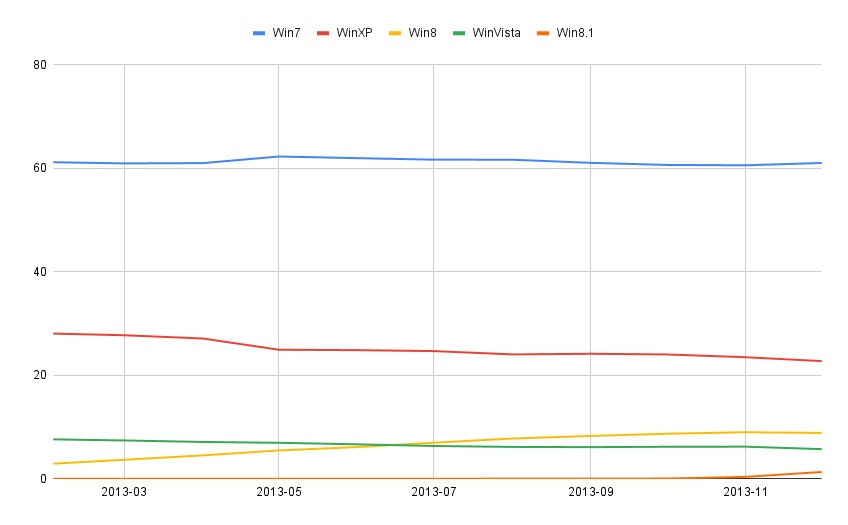
Microsoft was determined to address Windows 8 shortcomings and released Windows 8.1 in late 2013. By the end of the year, the new version had 2.48% of the market share. To see what was new in this update, check our Windows 8.1 features guide.
2014 – Windows 8.1 to overtake XP?
During 2014, Windows 7 remained the most used operating system, and its market share increased from 61.17% to 61.31%.
Windows XP was on the decline, dropping from 21.53% to 14.88%. The newly released Windows 8.1 was on the rise, and it went from 3.62% to 14.69% that year.
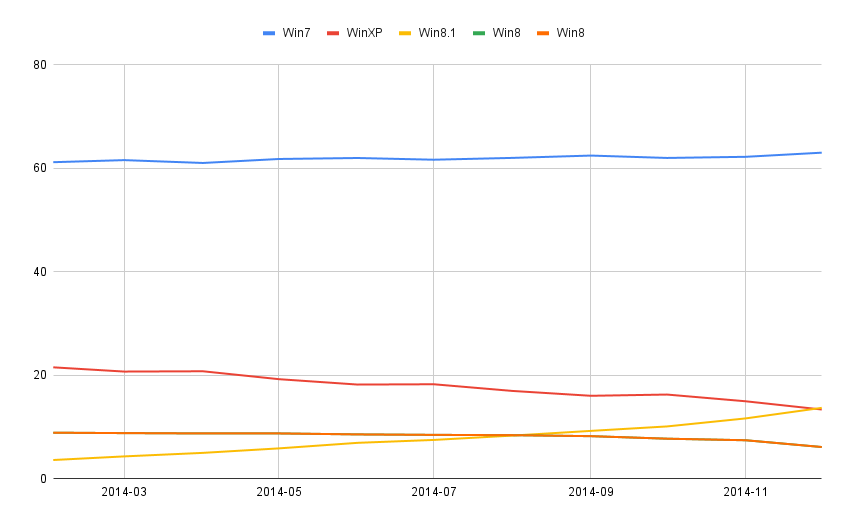
Windows 8 was surpassed by Windows 8.1, and its market share went from 8.9% to 5.26% which was expected. As for Vista, its market share decreased from 4.45% to 3.54%.
2015 – Windows 10 takes the market by storm
In 2015, Windows 7 was still the dominant operating system, but its market share begin to decline with the release of Windows 10 in July 2015.
Windows 7 market share went from 61.99% to 55.89% that year. Windows 8.1 was on the rise, and it achieved its peak in July, but it started to decline shortly after.
Regarding its market share, it went from 16.19% to 14.31%. Windows XP was also on the decline, and it dropped from 13.59% to 9.95%.
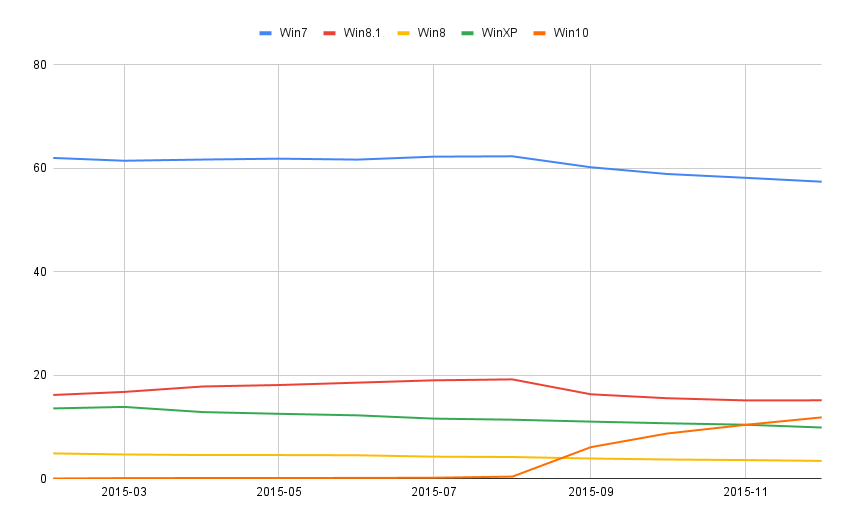
As previously mentioned, Windows 10 was released the same year, and in just a couple of months, it overtook XP, and it was on its way to overtaking Windows 8.1. By the end of 2015, it had 13.98% market share.
2016 – Windows 10 set to overtake Windows 7
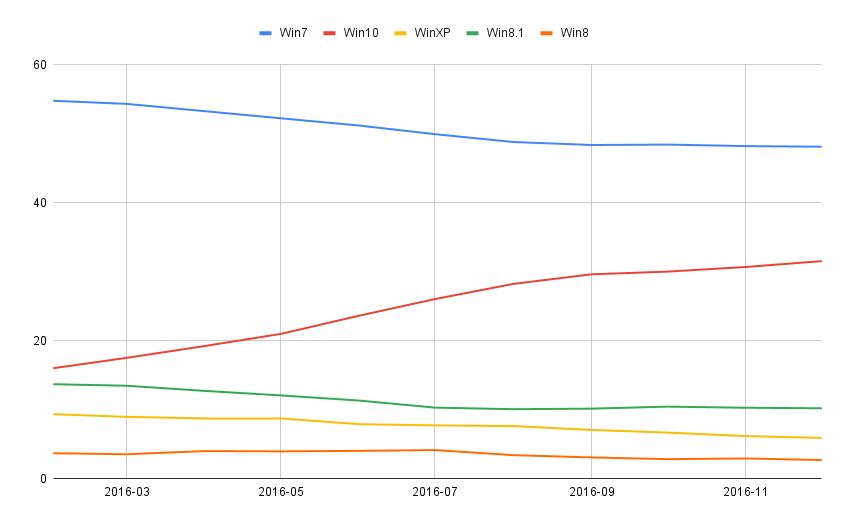
Windows 10 was on the steep rise, and in 2016 it went from 16.02% to 32.22% taking second place right after Windows 7.
As for Windows 7, it was on the decline, and it went from 54.78% to 47.74%. All other versions were declining, and Windows 8.1 went from 13.7% to 10%. As for XP, it went from 9.36% to 5.93%.
Although Windows XP was on its way out, many users want to keep using Windows XP, and we have a special guide that can help you with that.
For security reasons, it might be better to run Windows XP in a VM and continue using your operating system as the main one.
2017 – Windows 7 and Windows 10 clash for no.1 spot
2017 was an exciting year, and while Windows 7 was still the most used version, it was declining and losing its market share to Windows 10.
In one year, it fell from 47.46% to 41.89%. On the other hand, Windows 10 was on the rise, and it rose from 32.84% to 41.69 in 2017.
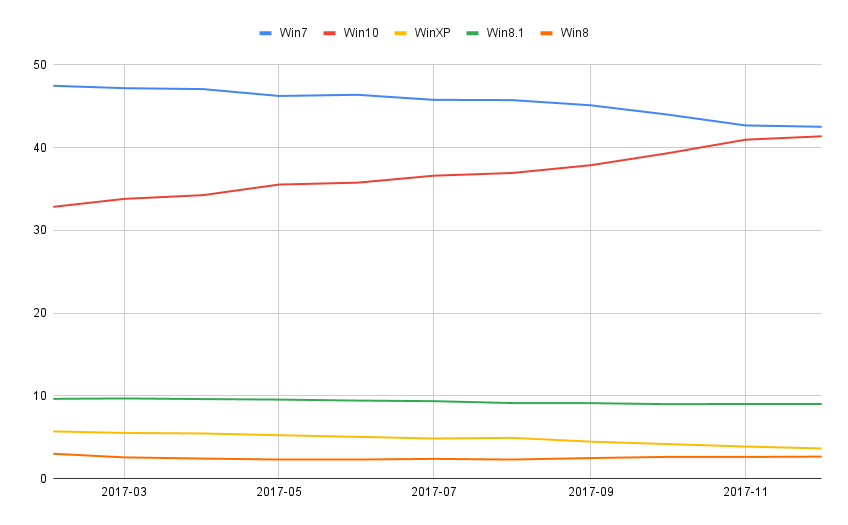
All other operating systems were on the decline, and Windows 8.1 went from 9.65% to 9.16%. As for Windows XP, it fell from 5.72% to 3.6%. Other versions of Windows had less than 3%.
2018 – Windows 10 dominates the market share
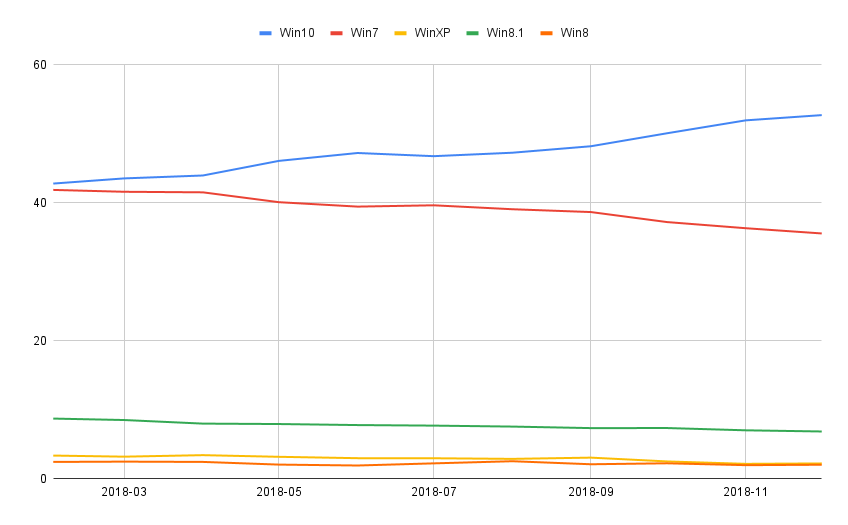
In 2018, Windows 10 finally overtook Windows 7, rising from 42.78% to 52.36%. Windows 7 was on the decline and its market share changed from 41.86% to 35.63%.
Windows 8.1 continued its decline from 8.72% to 6.95%. As for other versions of Windows, each had less than 3%.
2019 – The same trends continue
2019 was the year of Windows 10, and its market share went up from 53.18% to 65.4%. Windows 7 was on the decline and went from 35.05% to 26.79%.
As for Windows 8.1, it dropped from 6.67% to 4.87% that year. Other versions had negligible presence.

2020 – Windows 10 controls 75% of the market
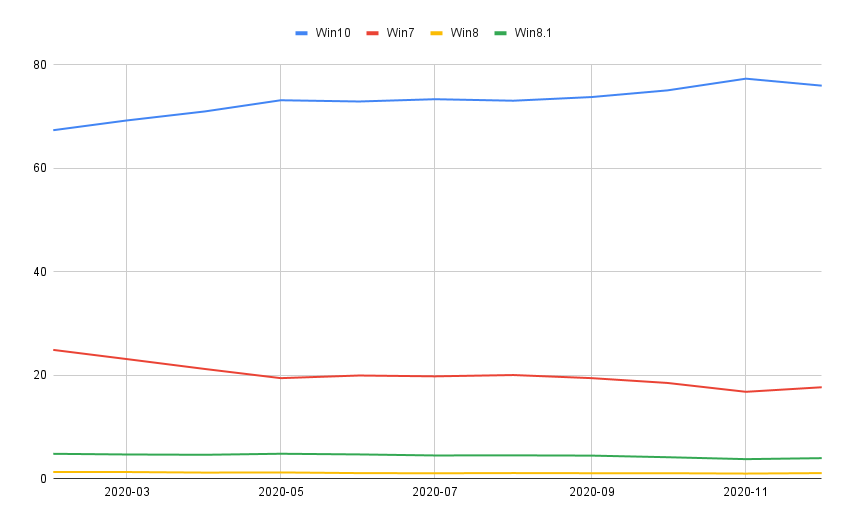
Just like the previous year, Windows 10 continued to rise, and its market share went up from 67.35% to 75.68%.
Windows 7 was losing market share, and it went from 24.9% to 18.03%. As for Windows 8.1, it had 4.82%, but by the end of the year, it reached 3.95%.
2021 – Another great year for Windows 10
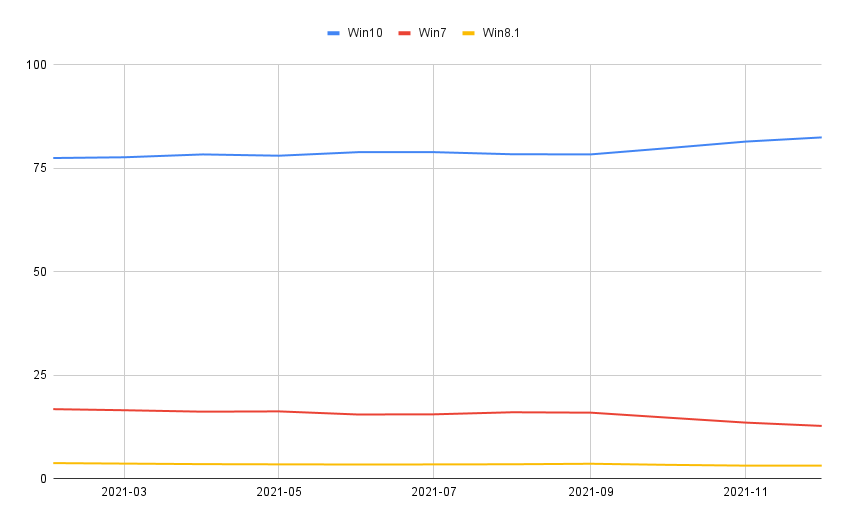
Windows 10 reigned supreme this year as well, and its market share went from 77.47% to 82.49%, a record for a Windows version.
Windows 7 was on the decline, and it dropped from 16.81% to 12.91%. Windows 8.1 was on the decline, going from 3.78% to 3.12%.
If you still want to continue using older versions, perhaps our guide on how to migrate Windows 7 to VM could be helpful to you.
2022 – Windows 11 on the rise
After a record-high market share, Windows 10 popularity begin to drop, and it went from 81.15% to 67.95%.
Windows 11 was recently released, and many Windows 10 users switched to it. This resulted in a steep rise from 2.6% to 16.97% by the end of the year. To learn more about it, we suggest reading our Windows 11 review for more information.
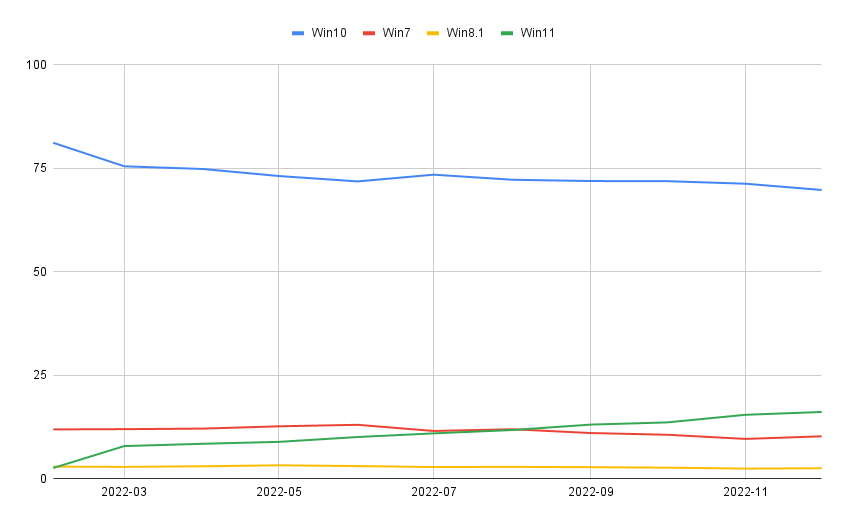
As for Windows 7, it was still on the decline and it went from 11.92% to 11.2%.
2023 – The same trend continues
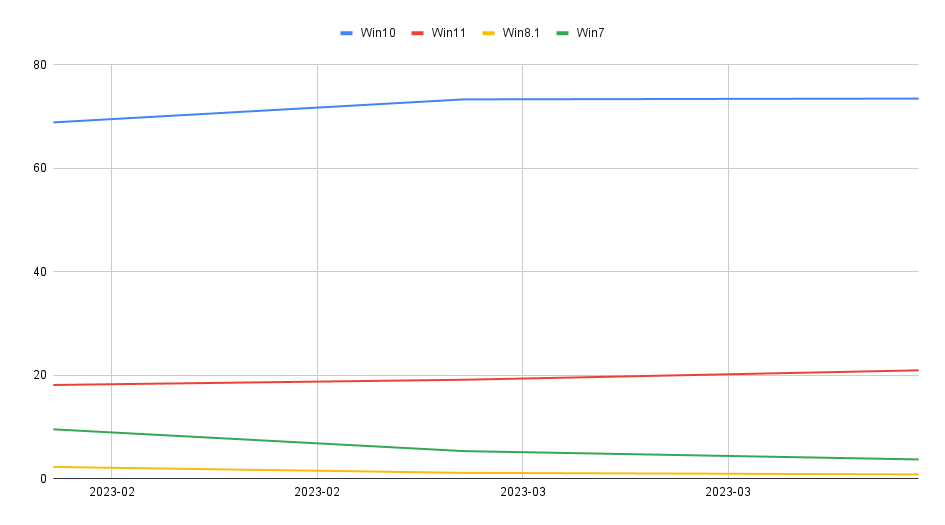
In 2023, Windows 10 had a small increase in users, but it dropped again. It went from 68.86% to 71.36% and we expect to see its market share drop in the upcoming months.
On the other side, Windows 11 is on the rise, and it went from 18.12% to 23.11% in April. To learn if it’s time to switch to Windows 11, we suggest you read our Windows 11 vs Windows 10 guide for more information. As for Windows 7, it went from 9.55% to a record-low 3.78% in April.
Is Windows losing market share?
Yes, Windows is losing market share, especially in the US. Globally Windows has 62.65% while Apple has 17.79%.

In the US, it has 53.21%, while macOS has 31.45%. It’s safe to say that Windows has been on a decline for several years now, and we have to wait and see what the future holds.
To learn about the differences between the two, be sure to read our Windows 11 vs macOS guide.

What is Windows’ biggest competitor?
The largest competitor for Windows is macOS, and in the US, Windows has slightly more than half of the market share while Apple has almost a third.
Looking at long-term changes, macOS has steadily risen while Windows was declining. Even if you’re using one another, you can always dual boot Windows 11 and macOS and get the best of both worlds.
Will Apple overtake Windows?
We are doubtful, especially when looking at the global market. Apple has achieved tremendous success in the US, and its market share is rising.
However, the situation is a bit different outside of the US, and most users don’t have the economic power to purchase a Mac computer, so they settle for a PC.
We hope that you found this guide informative and that you learned everything there is about Windows and its market share.
If you’re interested, you might want to check operating system market share throughout the years on different platforms.
What version of Windows do you use and why? Let us know in the comments below.

User forum
0 messages